Direct submissions to PCI Ecology from bioRxiv.org are possible using the B2J service
Latest recommendations

| Id | Title * | Authors * | Abstract * | Picture * | Thematic fields * ▲ | Recommender | Reviewers | Submission date | |
|---|---|---|---|---|---|---|---|---|---|
27 Jan 2023
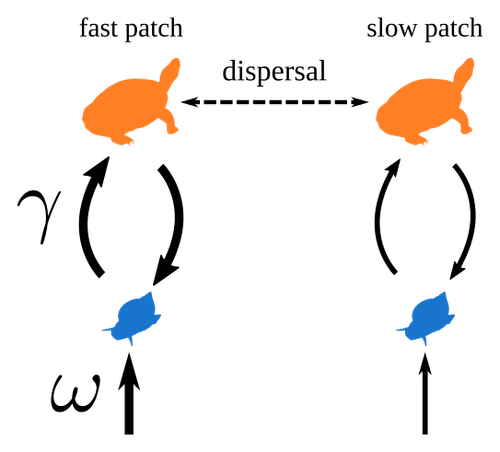
Spatial heterogeneity of interaction strength has contrasting effects on synchrony and stability in trophic metacommunitiesPierre Quévreux, Bart Haegeman and Michel Loreau https://hal.science/hal-03829838How does spatial heterogeneity affect stability of trophic metacommunities?Recommended by Werner Ulrich based on reviews by Phillip P.A. Staniczenko, Ludek Berec and Diogo Provete based on reviews by Phillip P.A. Staniczenko, Ludek Berec and Diogo Provete
The temporal or spatial variability in species population sizes and interaction strength of animal and plant communities has a strong impact on aggregate community properties (for instance biomass), community composition, and species richness (Kokkoris et al. 2002). Early work on spatial and temporal variability strongly indicated that asynchronous population and environmental fluctuations tend to stabilise community structures and diversity (e.g. Holt 1984, Tilman and Pacala 1993, McCann et al. 1998, Amarasekare and Nisbet 2001). Similarly, trophic networks might be stabilised by spatial heterogeneity (Hastings 1977) and an asymmetry of energy flows along food chains (Rooney et al. 2006). The interplay between temporal, spatial, and trophic heterogeneity within the meta-community concept has got much less interest. In the recent preprint in PCI Ecology, Quévreux et al. (2023) report that Spatial heterogeneity of interaction strength has contrasting effects on synchrony and stability in trophic metacommunities. These authors rightly notice that the interplay between trophic and spatial heterogeneity might induce contrasting effects depending on the internal dynamics of the system. Their contribution builds on prior work (Quévreux et al. 2021a, b) on perturbed trophic cascades. I found this paper particularly interesting because it is in the, now century-old, tradition to show that ecological things are not so easy. Since the 1930th, when Nicholson and Baily and others demonstrated that simple deterministic population models might generate stability and (pseudo-)chaos ecologists have realised that systems triggered by two or more independent processes might be intrinsically unpredictable and generate different outputs depending on the initial parameter settings. This resembles the three-body problem in physics. The present contribution of Quévreux et al. (2023) extends this knowledge to an example of a spatially explicit trophic model. Their main take-home message is that asymmetric energy flows in predator–prey relationships might have contrasting effects on the stability of metacommunities receiving localised perturbations. Stability is context dependent. Of course, the work is merely a theoretical exercise using a simplistic trophic model. It demands verification with field data. Nevertheless, we might expect even stronger unpredictability in more realistic multitrophic situations. Therefore, it should be seen as a proof of concept. Remember that increasing trophic connectance tends to destabilise food webs (May 1972). In this respect, I found the final outlook to bioconservation ambitious but substantiated. Biodiversity management needs a holistic approach focusing on all aspects of ecological functioning. I would add the need to see stability and biodiversity within an evolutionary perspective. References Amarasekare P, Nisbet RM (2001) Spatial Heterogeneity, Source‐Sink Dynamics, and the Local Coexistence of Competing Species. The American Naturalist, 158, 572–584. https://doi.org/10.1086/323586 Hastings A (1977) Spatial heterogeneity and the stability of predator-prey systems. Theoretical Population Biology, 12, 37–48. https://doi.org/10.1016/0040-5809(77)90034-X Holt RD (1984) Spatial Heterogeneity, Indirect Interactions, and the Coexistence of Prey Species. The American Naturalist, 124, 377–406. https://doi.org/10.1086/284280 Kokkoris GD, Jansen VAA, Loreau M, Troumbis AY (2002) Variability in interaction strength and implications for biodiversity. Journal of Animal Ecology, 71, 362–371. https://doi.org/10.1046/j.1365-2656.2002.00604.x May RM (1972) Will a Large Complex System be Stable? Nature, 238, 413–414. https://doi.org/10.1038/238413a0 McCann K, Hastings A, Huxel GR (1998) Weak trophic interactions and the balance of nature. Nature, 395, 794–798. https://doi.org/10.1038/27427 Quévreux P, Barbier M, Loreau M (2021) Synchrony and Perturbation Transmission in Trophic Metacommunities. The American Naturalist, 197, E188–E203. https://doi.org/10.1086/714131 Quévreux P, Pigeault R, Loreau M (2021) Predator avoidance and foraging for food shape synchrony and response to perturbations in trophic metacommunities. Journal of Theoretical Biology, 528, 110836. https://doi.org/10.1016/j.jtbi.2021.110836 Quévreux P, Haegeman B, Loreau M (2023) Spatial heterogeneity of interaction strength has contrasting effects on synchrony and stability in trophic metacommunities. hal-03829838, ver. 2 peer-reviewed and recommended by Peer Community in Ecology. https://hal.science/hal-03829838 Rooney N, McCann K, Gellner G, Moore JC (2006) Structural asymmetry and the stability of diverse food webs. Nature, 442, 265–269. https://doi.org/10.1038/nature04887 Tilman D, Pacala S (1993) The maintenance of species richness in plant communities. In: Ricklefs, R.E., Schluter, D. (eds) Species Diversity in Ecological Communities: Historical and Geographical Perspectives. University of Chicago Press, pp. 13–25. | Spatial heterogeneity of interaction strength has contrasting effects on synchrony and stability in trophic metacommunities | Pierre Quévreux, Bart Haegeman and Michel Loreau | <p> Spatial heterogeneity is a fundamental feature of ecosystems, and ecologists have identified it as a factor promoting the stability of population dynamics. In particular, differences in interaction strengths and resource supply between pa... |  | Dispersal & Migration, Food webs, Interaction networks, Spatial ecology, Metacommunities & Metapopulations, Theoretical ecology | Werner Ulrich | 2022-10-26 13:38:34 | View | |
16 Jun 2020
Environmental perturbations and transitions between ecological and evolutionary equilibria: an eco-evolutionary feedback frameworkTim Coulson https://doi.org/10.1101/509067Stasis and the phenotypic gambitRecommended by Tom Van Dooren based on reviews by Jacob Johansson, Katja Räsänen and 1 anonymous reviewerThe preprint "Environmental perturbations and transitions between ecological and evolutionary equilibria: an eco-evolutionary feedback framework" by Coulson (2020) presents a general framework for evolutionary ecology, useful to interpret patterns of selection and evolutionary responses to environmental transitions. The paper is written in an accessible and intuitive manner. It reviews important concepts which are at the heart of evolutionary ecology. Together, they serve as a worldview which you can carry with you to interpret patterns in data or observations in nature. I very much appreciate it that Coulson (2020) presents his personal intuition laid bare, the framework he uses for his research and how several strong concepts from theoretical ecology fit in there. Overviews as presented in this paper are important to understand how we as researchers put the pieces together. References [1] Coulson, T. (2020) Environmental perturbations and transitions between ecological and evolutionary equilibria: an eco-evolutionary feedback framework. bioRxiv, 509067, ver. 4 peer-reviewed and recommended by PCI Ecology. doi: 10.1101/509067 | Environmental perturbations and transitions between ecological and evolutionary equilibria: an eco-evolutionary feedback framework | Tim Coulson | <p>I provide a general framework for linking ecology and evolution. I start from the fact that individuals require energy, trace molecules, water, and mates to survive and reproduce, and that phenotypic resource accrual traits determine an individ... |  | Eco-evolutionary dynamics, Evolutionary ecology | Tom Van Dooren | 2019-01-03 10:05:16 | View | |
05 Jun 2024
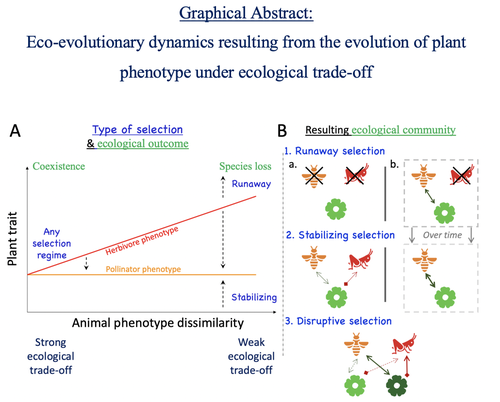
Attracting pollinators vs escaping herbivores: eco-evolutionary dynamics of plants confronted with an ecological trade-offYoussef Yacine, Nicolas Loeuille https://doi.org/10.1101/2021.12.02.470900Plant-herbivore-pollinator ménage-à-trois: tell me how well they match, and I'll tell you if it's made to lastRecommended by Sylvain Billiard based on reviews by Marcos Mendez and Yaroslav Ispolatov based on reviews by Marcos Mendez and Yaroslav Ispolatov
How would a plant trait evolve if it is involved in interacting with both a pollinator and an herbivore species? The answer by Yacine and Loeuille is straightforward: it is not trivial, but it can explain many situations found in natural populations. Yacine and Loeuille applied the well-known Adaptive Dynamics framework to a system with three interacting protagonists: a herbivore, a pollinator, and a plant. The evolution of a plant trait is followed under the assumption that it regulates the frequency of interaction with the two other species. As one can imagine, that is where problems begin: interacting more with pollinators seems good, but what if at the same time it implies interacting more with herbivores? And that's not a silly idea, as there are many cases where herbivores and pollinators share the same cues to detect plants, such as colors or chemical compounds. They found that depending on the trade-off between the two types of interactions and their density-dependent effects on plant fitness, the possible joint ecological and evolutionary outcomes are numerous. When herbivory prevails, evolution can make the ménage-à-trois ecologically unstable, as one or even two species can go extinct, leaving the plant alone. Evolution can also make the coexistence of the three species more stable when pollination services prevail, or lead to the appearance of a second plant species through branching diversification of the plant trait when herbivory and pollination are balanced. Yacine and Loeuille did not only limit themselves to saying "it is possible," but they also did much work evaluating when each evolutionary outcome would occur. They numerically explored in great detail the adaptive landscape of the plant trait for a large range of parameter values. They showed that the global picture is overall robust to parameter variations, strengthening the plausibility that the evolution of a trait involved in antagonistic interactions can explain many of the correlations between plant and animal traits or phylogenies found in nature. Are we really there yet? Of course not, as some assumptions of the model certainly limit its scope. Are there really cases where plants' traits evolve much faster than herbivores' and pollinators' traits? Certainly not, but the model is so general that it can apply to any analogous system where one species is caught between a mutualistic and a predator species, including potential species that evolve much faster than the two others. And even though this limitation might cast doubt on the generality of the model's predictions, studying a system where a species' trait and a preference trait coevolve is possible, as other models have already been studied (see Fritsch et al. 2021 for a review in the case of evolution in food webs). We can bet this is the next step taken by Yacine and Loeuille in a similar framework with the same fundamental model, promising fascinating results, especially regarding the evolution of complex communities when species can accumulate after evolutionary branchings. Relaxing another assumption seems more challenging as it would certainly need to change the model itself: interacting species generally do not play fixed roles, as being mutualistic or antagonistic might generally be density-dependent (Holland and DeAngelis 2010). How would the exchange of resources between three interacting species evolve? It is an open question. References Fritsch, C., Billiard, S., & Champagnat, N. (2021). Identifying conversion efficiency as a key mechanism underlying food webs adaptive evolution: a step forward, or backward? Oikos, 130(6), 904-930. Yacine, Y., & Loeuille, N. (2024) Attracting pollinators vs escaping herbivores: eco-evolutionary dynamics of plants confronted with an ecological trade-off. bioRxiv 2021.12.02.470900; doi: https://doi.org/10.1101/2021.12.02.470900 | Attracting pollinators vs escaping herbivores: eco-evolutionary dynamics of plants confronted with an ecological trade-off | Youssef Yacine, Nicolas Loeuille | <p style="text-align: justify;">Many plant traits are subject to an ecological trade-off between attracting pollinators and escaping herbivores. The interplay of both plant-animal interaction types determines their evolution. As most studies focus... |  | Eco-evolutionary dynamics, Herbivory, Pollination, Theoretical ecology | Sylvain Billiard | 2023-03-21 14:23:12 | View | |
13 May 2023
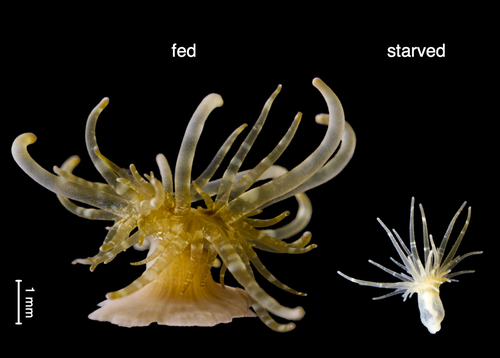
Symbiotic nutrient cycling enables the long-term survival of Aiptasia in the absence of heterotrophic food sourcesNils Radecker, Anders Meibom https://doi.org/10.1101/2022.12.07.519152Constraining the importance of heterotrophic vs autotrophic feeding in photosymbiotic cnidariansRecommended by Ulisse Cardini based on reviews by 2 anonymous reviewers based on reviews by 2 anonymous reviewers
The symbiosis with autotrophic dinoflagellate algae has enabled heterotrophic Cnidaria to thrive in nutrient-poor tropical waters (Muscatine and Porter 1977; Stanley 2006). In particular, mixotrophy, i.e. the ability to acquire nutrients through both autotrophy and heterotrophy, confers a competitive edge in oligotrophic waters, allowing photosymbiotic Cnidaria to outcompete benthic organisms limited to a single diet (e.g., McCook 2001). However, the relative importance of autotrophy vs heterotrophy in sustaining symbiotic cnidarian’s nutrition is still the subject of intense research. In fact, figuring out the cellular mechanisms by which symbiotic Cnidaria acquire a balanced diet for their metabolism and growth is relevant to our understanding of their physiology under varying environmental conditions and in response to anthropogenic perturbations. In this study's long-term starvation experiment, Radecker & Meibom (2023) investigated the survival of the photosymbiotic sea anemone Aiptasia in the absence of heterotrophic feeding. After one year of heterotrophic starvation, Apitasia anemones remained fully viable but showed an 85 % reduction in biomass. Using 13C-bicarbonate and 15N-ammonium labeling, electron microscopy and NanoSIMS imaging, the authors could clearly show that the contribution of algal-derived nutrients to the host metabolism remained unaffected as a result of increased algal photosynthesis and more efficient carbon translocation. At the same time, the absence of heterotrophic feeding caused severe nitrogen limitation in the starved Apitasia anemones. Overall, this study provides valuable insights into nutrient exchange within the symbiosis between Cnidaria and dinoflagellate algae at the cellular level and sheds new light on the importance of heterotrophic feeding as a nitrogen acquisition strategy for holobiont growth in oligotrophic waters. REFERENCES McCook L (2001) Competition between corals and algal turfs along a gradient of terrestrial influence in the nearshore central Great Barrier Reef. Coral Reefs 19:419–425. https://doi.org/10.1007/s003380000119 Muscatine L, Porter JW (1977) Reef corals: mutualistic symbioses adapted to nutrient-poor environments. Bioscience 27:454–460. https://doi.org/10.2307/1297526 Radecker N, Meibom A (2023) Symbiotic nutrient cycling enables the long-term survival of Aiptasia in the absence of heterotrophic food sources. bioRxiv, ver. 3 peer-reviewed and recommended by Peer Community in Ecology. https://doi.org/10.1101/2022.12.07.519152 Stanley GD Jr (2006) Photosymbiosis and the evolution of modern coral reefs. Science 312:857–858. https://doi.org/10.1126/science.1123701 | Symbiotic nutrient cycling enables the long-term survival of Aiptasia in the absence of heterotrophic food sources | Nils Radecker, Anders Meibom | <p style="text-align: justify;">Phototrophic Cnidaria are mixotrophic organisms that can complement their heterotrophic diet with nutrients assimilated by their algal endosymbionts. Metabolic models suggest that the translocation of photosynthates... |  | Eco-evolutionary dynamics, Microbial ecology & microbiology, Symbiosis | Ulisse Cardini | 2022-12-12 10:50:55 | View | |
10 Oct 2018

Detecting within-host interactions using genotype combination prevalence dataSamuel Alizon, Carmen Lía Murall, Emma Saulnier, Mircea T Sofonea https://doi.org/10.1101/256586Combining epidemiological models with statistical inference can detect parasite interactionsRecommended by Dustin Brisson based on reviews by Samuel Díaz Muñoz, Erick Gagne and 1 anonymous reviewerThere are several important topics in the study of infectious diseases that have not been well explored due to technical difficulties. One such topic is pursued by Alizon et al. in “Modelling coinfections to detect within-host interactions from genotype combination prevalences” [1]. Both theory and several important examples have demonstrated that interactions among co-infecting strains can have outsized impacts on disease outcomes, transmission dynamics, and epidemiology. Unfortunately, empirical data on pathogen interactions and their outcomes is often correlational making results difficult to decipher. References [1] Alizon, S., Murall, C.L., Saulnier, E., & Sofonea, M.T. (2018). Detecting within-host interactions using genotype combination prevalence data. bioRxiv, 256586, ver. 3 peer-reviewed and recommended by PCI Ecology. doi: 10.1101/256586 | Detecting within-host interactions using genotype combination prevalence data | Samuel Alizon, Carmen Lía Murall, Emma Saulnier, Mircea T Sofonea | <p>Parasite genetic diversity can provide information on disease transmission dynamics but most methods ignore the exact combinations of genotypes in infections. We introduce and validate a new method that combines explicit epidemiological modelli... |  | Eco-immunology & Immunity, Epidemiology, Host-parasite interactions, Statistical ecology | Dustin Brisson | Samuel Díaz Muñoz, Erick Gagne | 2018-02-01 09:23:26 | View |
14 Dec 2022
The contrasted impacts of grasshoppers on soil microbial activities in function of primary production and herbivore dietSébastien Ibanez, Arnaud Foulquier, Charles Brun, Marie-Pascale Colace, Gabin Piton, Lionel Bernard, Christiane Gallet, Jean-Christophe Clément https://doi.org/10.1101/2022.07.04.497718Complex interactions between ecosystem productivity and herbivore diets lead to non-predicted effects on nutrient cyclingRecommended by Sébastien Barot based on reviews by Manuel Blouin and Tord Ranheim SveenThe authors present a study typical of the field of belowground-aboveground interactions [1]. This framework has been extremely fruitful since the beginning of 2000s [2]. It has also contributed to bridge the gap between soil ecology and the rest of ecology [3]. The study also pertains to the rich field on the impacts of herbivores on soil functioning [4]. The study more precisely tested during two years the effect on nutrient cycling of the interaction between the type of grassland (along a gradient of biomass productivity) and the diet of the community of insect herbivores (5 treatments manipulating the grasshopper community on 1 m2 plots, with a gradient from no grasshopper to grasshoppers either specialized on forbs or grasses). What seems extremely interesting is that the study is based on a rigorous hypothesis-testing approach. They compare the predictions of two frameworks: (1) The “productivity model” predicts that in productive ecosystems herbivores consume a high percentage of the net primary production thus accelerating nutrient cycling. (2) The “diet model” distinguishes herbivores consuming exploitative plants from those eating conservative plants. The former (later) type of herbivores favours conservative (exploitative) plants therefore decelerating (accelerating) nutrient cycling. Interestingly, the two frameworks have similar predictions (and symmetrically opposite predictions) in two cases out of four combinations between ecosystem productivities and types of diet (see Table 1). An other merit of the study is to combine in a rather comprehensive way all the necessary measurements to test these frameworks in combination: grasshopper diet, soil properties, characteristics of the soil microbial community, plant traits, vegetation survey and plant biomass. The results were in contradiction with the ‘‘diet model’’: microbial properties and nitrogen cycling did not depend on grasshopper diet. The productivity of the grasslands did impact nutrient cycling but not in the direction predicted by the “productivity model”: productive grasslands hosted exploitative plants that depleted N resources in the soil and microbes producing few extracellular enzymes, which led to a lower potential N mineralization and a deceleration of nutrient cycling. Because, the authors stuck to their original hypotheses (that were not confirmed), they were able to discuss in a very relevant way their results and to propose some interpretations, at least partially based on the time scales involved by the productivity and diet models. Beyond all the merits of this article, I think that two issues remain largely open in relation with the dynamics of the studied systems, and would deserve future research efforts. First, on the ‘‘short’’ term (up to several decades), can we predict how the communities of plants, soil microbes, and herbivores interact to drive the dynamics of the ecosystems? Second, at the evolutionary time scale, can we understand and predict the interactions between the evolution of plant, microbe and herbivore strategies and the consequences for the functioning of the grasslands? The two issues are difficult because of the multiple feedbacks involved. One way to go further would be to complement the empirical approach with models along existing research avenues [5, 6]. References [1] Ibanez S, Foulquier A, Brun C, Colace M-P, Piton G, Bernard L, Gallet C, Clément J-C (2022) The contrasted impacts of grasshoppers on soil microbial activities in function of primary production and herbivore diet. bioRxiv, 2022.07.04.497718, ver. 2 peer-reviewed and recommended by Peer Community in Ecology. https://doi.org/10.1101/2022.07.04.497718 [2] Hooper, D. U., Bignell, D. E., Brown, V. K., Brussaard, L., Dangerfield, J. M., Wall, D. H., Wardle, D. A., Coleman, D. C., Giller, K. E., Lavelle, P., Van der Putten, W. H., De Ruiter, P. C., et al. 2000. Interactions between aboveground and belowground biodiversity in terretrial ecosystems: patterns, mechanisms, and feedbacks. BioScience, 50, 1049-1061. https://doi.org/10.1641/0006-3568(2000)050[1049:IBAABB]2.0.CO;2 [3] Barot, S., Blouin, M., Fontaine, S., Jouquet, P., Lata, J.-C., and Mathieu, J. 2007. A tale of four stories: soil ecology, theory, evolution and the publication system. PLoS ONE, 2, e1248. https://doi.org/10.1371/journal.pone.0001248 [4] Bardgett, R. D., and Wardle, D. A. 2003. Herbivore-mediated linkages between aboveground and belowground communities. Ecology, 84, 2258-2268. https://doi.org/10.1890/02-0274 [5] Barot, S., Bornhofen, S., Loeuille, N., Perveen, N., Shahzad, T., and Fontaine, S. 2014. Nutrient enrichment and local competition influence the evolution of plant mineralization strategy, a modelling approach. J. Ecol., 102, 357-366. https://doi.org/10.1111/1365-2745.12200 [6] Schweitzer, J. A., Juric, I., van de Voorde, T. F. J., Clay, K., van der Putten, W. H., Bailey, J. K., and Fox, C. 2014. Are there evolutionary consequences of plant-soil feedbacks along soil gradients? Func. Ecol., 28, 55-64. https://doi.org/10.1111/1365-2435.12201
| The contrasted impacts of grasshoppers on soil microbial activities in function of primary production and herbivore diet | Sébastien Ibanez, Arnaud Foulquier, Charles Brun, Marie-Pascale Colace, Gabin Piton, Lionel Bernard, Christiane Gallet, Jean-Christophe Clément | <p style="text-align: justify;">Herbivory can have contrasted impacts on soil microbes and nutrient cycling, which has stimulated the development of conceptual frameworks exploring the links between below- and aboveground processes. The "productiv... | Ecosystem functioning, Herbivory, Soil ecology, Terrestrial ecology | Sébastien Barot | 2022-07-14 09:06:13 | View | ||
09 Dec 2019

Niche complementarity among pollinators increases community-level plant reproductive successAinhoa Magrach, Francisco P. Molina, Ignasi Bartomeus https://doi.org/10.1101/629931Improving our knowledge of species interaction networksRecommended by Cédric Gaucherel based on reviews by Michael Lattorff, Nicolas Deguines and 3 anonymous reviewers based on reviews by Michael Lattorff, Nicolas Deguines and 3 anonymous reviewers
Ecosystems shelter a huge number of species, continuously interacting. Each species interact in various ways, with trophic interactions, but also non-trophic interactions, not mentioning the abiotic and anthropogenic interactions. In particular, pollination, competition, facilitation, parasitism and many other interaction types are simultaneously present at the same place in terrestrial ecosystems [1-2]. For this reason, we need today to improve our understanding of such complex interaction networks to later anticipate their responses. This program is a huge challenge facing ecologists and they today join their forces among experimentalists, theoreticians and modelers. While some of us struggle in theoretical and modeling dimensions [3-4], some others perform brilliant works to observe and/or experiment on the same ecological objects [5-6]. References [1] Campbell, C., Yang, S., Albert, R., and Shea, K. (2011). A network model for plant–pollinator community assembly. Proceedings of the National Academy of Sciences, 108(1), 197-202. doi: 10.1073/pnas.1008204108 | Niche complementarity among pollinators increases community-level plant reproductive success | Ainhoa Magrach, Francisco P. Molina, Ignasi Bartomeus | <p>Declines in pollinator diversity and abundance have been reported across different regions, with implications for the reproductive success of plant species. However, research has focused primarily on pairwise plant-pollinator interactions, larg... |  | Ecosystem functioning, Interaction networks, Pollination, Terrestrial ecology | Cédric Gaucherel | Nicolas Deguines | 2019-05-07 17:03:23 | View |
01 Mar 2024
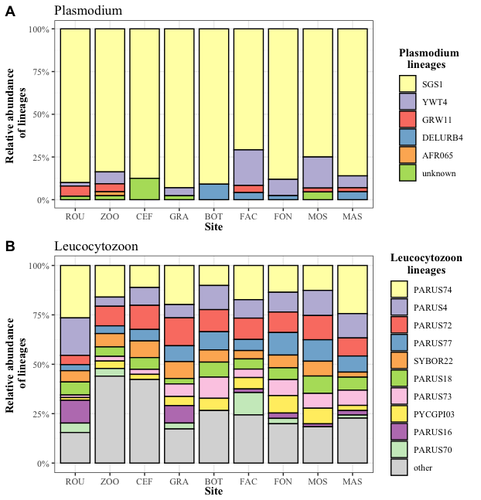
Cities as parasitic amplifiers? Malaria prevalence and diversity in great tits along an urbanization gradientAude E. Caizergues, Benjamin Robira, Charles Perrier, Melanie Jeanneau, Arnaud Berthomieu, Samuel Perret, Sylvain Gandon, Anne Charmantier https://doi.org/10.1101/2023.05.03.539263Exploring the Impact of Urbanization on Avian Malaria Dynamics in Great Tits: Insights from a Study Across Urban and Non-Urban EnvironmentsRecommended by Adrian Diaz based on reviews by Ana Paula Mansilla and 2 anonymous reviewersAcross the temporal expanse of history, the impact of human activities on global landscapes has manifested as a complex interplay of ecological alterations. From the advent of early agricultural practices to the successive waves of industrialization characterizing the 18th and 19th centuries, anthropogenic forces have exerted profound and enduring transformations upon Earth's ecosystems. Indeed, by 2017, more than 80% of the terrestrial biosphere was transformed by human populations and land use, and just 19% remains as wildlands (Ellis et al. 2021). Caizergues AE, Robira B, Perrier C, Jeanneau M, Berthomieu A, Perret S, Gandon S, Charmantier A (2023) Cities as parasitic amplifiers? Malaria prevalence and diversity in great tits along an urbanization gradient. bioRxiv, 2023.05.03.539263, ver. 3 peer-reviewed and recommended by Peer Community in Ecology. https://doi.org/10.1101/2023.05.03.539263 Ellis EC, Gauthier N, Klein Goldewijk K, Bliege Bird R, Boivin N, Díaz S, Fuller DQ, Gill JL, Kaplan JO, Kingston N, Locke H, McMichael CNH, Ranco D, Rick TC, Shaw MR, Stephens L, Svenning JC, Watson JEM. People have shaped most of terrestrial nature for at least 12,000 years. Proc Natl Acad Sci U S A. 2021 Apr 27;118(17):e2023483118. https://doi.org/10.1073/pnas.2023483118. Faeth SH, Bang C, Saari S (2011) Urban biodiversity: Patterns and mechanisms. Ann N Y Acad Sci 1223:69–81. https://doi.org/10.1111/j.1749-6632.2010.05925.x Faeth SH, Bang C, Saari S (2011) Urban biodiversity: Patterns and mechanisms. Ann N Y Acad Sci 1223:69–81. https://doi.org/10.1111/j.1749-6632.2010.05925.x Reyes R, Ahn R, Thurber K, Burke TF (2013) Urbanization and Infectious Diseases: General Principles, Historical Perspectives, and Contemporary Challenges. Challenges Infect Dis 123. https://doi.org/10.1007/978-1-4614-4496-1_4 | Cities as parasitic amplifiers? Malaria prevalence and diversity in great tits along an urbanization gradient | Aude E. Caizergues, Benjamin Robira, Charles Perrier, Melanie Jeanneau, Arnaud Berthomieu, Samuel Perret, Sylvain Gandon, Anne Charmantier | <p style="text-align: justify;">Urbanization is a worldwide phenomenon that modifies the environment. By affecting the reservoirs of pathogens and the body and immune conditions of hosts, urbanization alters the epidemiological dynamics and divers... |  | Epidemiology, Host-parasite interactions, Human impact | Adrian Diaz | Anonymous, Gauthier Dobigny, Ana Paula Mansilla | 2023-09-11 20:24:44 | View |
02 Jan 2024
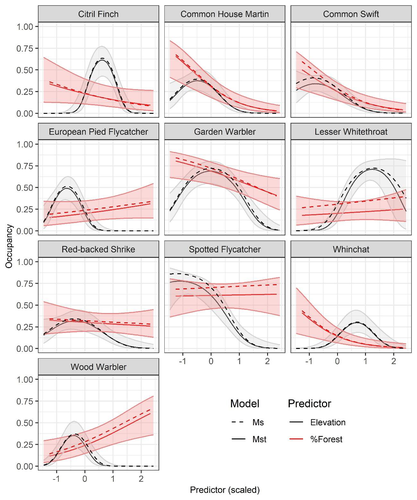
Mt or not Mt: Temporal variation in detection probability in spatial capture-recapture and occupancy modelsRahel Sollmann https://doi.org/10.1101/2023.08.08.552394Useful clarity on the value of considering temporal variability in detection probabilityRecommended by Benjamin Bolker based on reviews by Dana Karelus and Ben Augustine based on reviews by Dana Karelus and Ben Augustine
As so often quoted, "all models are wrong; more specifically, we always neglect potentially important factors in our models of ecological systems. We may neglect these factors because no-one has built a computational framework to include them; because including them would be computationally infeasible; or because we don't have enough data. When considering whether to include a particular process or form of heterogeneity, the gold standard is to fit models both with and without the component, and then see whether we needed the component in the first place -- that is, whether including that component leads to an important difference in our conclusions. However, this approach is both tedious and endless, because there are an infinite number of components that we could consider adding to any given model. Therefore, thoughtful exercises that evaluate the importance of particular complications under a realistic range of simulations and a representative set of case studies are extremely valuable for the field. While they cannot provide ironclad guarantees, they give researchers a general sense of when they can (probably) safely ignore some factors in their analyses. This paper by Sollmann (2024) shows that for a very wide range of scenarios, temporal and spatiotemporal variability in the probability of detection have little effect on the conclusions of spatial capture-recapture and occupancy models. The author is thoughtful about when such variability may be important, e.g. when variation in detection and density is correlated and thus confounded, or when variation is driven by animals' behavioural responses to being captured. | Mt or not Mt: Temporal variation in detection probability in spatial capture-recapture and occupancy models | Rahel Sollmann | <p>State variables such as abundance and occurrence of species are central to many questions in ecology and conservation, but our ability to detect and enumerate species is imperfect and often varies across space and time. Accounting for imperfect... |  | Euring Conference, Statistical ecology | Benjamin Bolker | Dana Karelus, Ben Augustine, Ben Augustine | 2023-08-10 09:18:56 | View |
24 May 2023
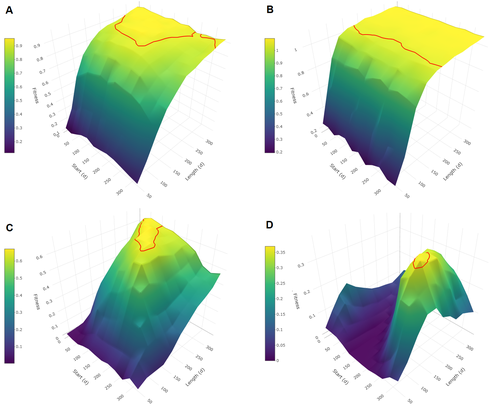
Evolutionary determinants of reproductive seasonality: a theoretical approachLugdiwine Burtschell, Jules Dezeure, Elise Huchard, Bernard Godelle https://doi.org/10.1101/2022.08.22.504761When does seasonal reproduction evolve?Recommended by Tim Coulson based on reviews by Francois-Xavier Dechaume-Moncharmont, Nigel Yoccoz and 1 anonymous reviewer based on reviews by Francois-Xavier Dechaume-Moncharmont, Nigel Yoccoz and 1 anonymous reviewer
Have you ever wondered why some species breed seasonally while others do not? You might think it is all down to lattitude and the harshness of winters but it turns out it is quite a bit more complicated than that. A consequence of this is that climate change may result in the evolution of the degree of seasonal reproduction, with some species perhaps becoming less seasonal and others more so even in the same habitat. Burtschell et al. (2023) investigated how various factors influence seasonal breeding by building an individual-based model of a baboon population from which they calculated the degree of seasonality for the fittest reproductive strategy. They then altered key aspects of their model to examine how these changes impacted the degree of seasonality in the reproductive strategy. What they found is fascinating. The degree of seasonality in reproductive strategy is expected to increase with increased seasonality in the environment, decreased food availability, increased energy expenditure, and how predictable resource availability is. Interestingly, neither female cycle length nor extrinsic infant mortality influenced the degree of seasonality in reproduction. What this means in reality for seasonal species is more challenging to understand. Some environments appear to be becoming more seasonal yet less predictable, and some species appear to be altering their daily energy budgets in response to changing climate in quite complex ways. As with pretty much everything in biology, Burtschell et al.'s work reveals much nuance and complexity, and that predicting how species might alter their reproductive timing is fraught with challenges. The paper is very well written. With a simpler model it may have proven possible to achieve analytical solutions, but this is a very minor gripe. The reviewers were positive about the paper, and I have little doubt it will be well-cited. REFERENCES Burtschell L, Dezeure J, Huchard E, Godelle B (2023) Evolutionary determinants of reproductive seasonality: a theoretical approach. bioRxiv, 2022.08.22.504761, ver. 2 peer-reviewed and recommended by Peer Community in Ecology. https://doi.org/10.1101/2022.08.22.504761 | Evolutionary determinants of reproductive seasonality: a theoretical approach | Lugdiwine Burtschell, Jules Dezeure, Elise Huchard, Bernard Godelle | <p style="text-align: justify;">Reproductive seasonality is a major adaptation to seasonal cycles and varies substantially among organisms. This variation, which was long thought to reflect a simple latitudinal gradient, remains poorly understood ... |  | Evolutionary ecology, Life history, Theoretical ecology | Tim Coulson | Nigel Yoccoz | 2022-08-23 21:37:28 | View |
MANAGING BOARD
Julia Astegiano
Tim Coulson
Anna Eklof
Dominique Gravel
François Massol
Ben Phillips
Cyrille Violle


