Direct submissions to PCI Ecology from bioRxiv.org are possible using the B2J service
Latest recommendations

| Id | Title * | Authors * | Abstract * | Picture * | Thematic fields * ▲ | Recommender | Reviewers | Submission date | |
|---|---|---|---|---|---|---|---|---|---|
05 Apr 2019

Using a large-scale biodiversity monitoring dataset to test the effectiveness of protected areas at conserving North-American breeding birdsProtected Areas effects on biodiversity: a test using bird data that hopefully will give ideas for much more studies to comeRecommended by Paul Caplat based on reviews by Willson Gaul and 1 anonymous reviewerIn the face of worldwide declines in biodiversity, evaluating the effectiveness of conservation practices is an absolute necessity. Protected Areas (PA) are a key tool for conservation, and the question “Are PA effective” has been on many a research agenda, as the introduction to this preprint will no doubt convince you. A challenge we face is that, until now, few studies have been explicitly designed to evaluate PA, and despite the rise of meta-analyses on the topic, our capacity to quantify their effect on biodiversity remains limited. References [1] Cazalis, V., Belghali, S., & Rodrigues, A. S. (2019). Using a large-scale biodiversity monitoring dataset to test the effectiveness of protected areas at conserving North-American breeding birds. bioRxiv, 433037, ver. 4 peer-reviewed and recommended by PCI Ecology. doi: 10.1101/433037 | Using a large-scale biodiversity monitoring dataset to test the effectiveness of protected areas at conserving North-American breeding birds | Victor Cazalis, Soumaya Belghali, Ana S.L. Rodrigues | <p>Protected areas currently cover about 15% of the global land area, and constitute one of the main tools in biodiversity conservation. Quantifying their effectiveness at protecting species from local decline or extinction involves comparing prot... | | Biodiversity, Conservation biology, Human impact, Landscape ecology, Macroecology | Paul Caplat | 2018-10-04 08:43:34 | ||
15 Feb 2024
Sources of confusion in global biodiversity trendsUnraveling the Complexity of Global Biodiversity Dynamics: Insights and ImperativesRecommended by Paulo Borges based on reviews by Pedro Cardoso and 1 anonymous reviewer based on reviews by Pedro Cardoso and 1 anonymous reviewer
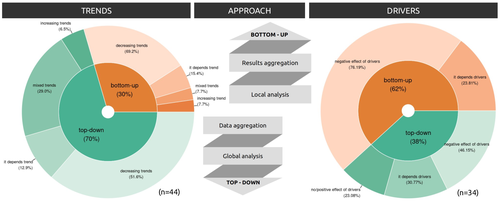
Biodiversity loss is occurring at an alarming rate across terrestrial and marine ecosystems, driven by various processes that degrade habitats and threaten species with extinction. Despite the urgency of this issue, empirical studies present a mixed picture, with some indicating declining trends while others show more complex patterns. In a recent effort to better understand global biodiversity dynamics, Boennec et al. (2024) conducted a comprehensive literature review examining temporal trends in biodiversity. Their analysis reveals that reviews and meta-analyses, coupled with the use of global indicators, tend to report declining trends more frequently. Additionally, the study underscores a critical gap in research: the scarcity of investigations into the combined impact of multiple pressures on biodiversity at a global scale. This lack of understanding complicates efforts to identify the root causes of biodiversity changes and develop effective conservation strategies. This study serves as a crucial reminder of the pressing need for long-term biodiversity monitoring and large-scale conservation studies. By filling these gaps in knowledge, researchers can provide policymakers and conservation practitioners with the insights necessary to mitigate biodiversity loss and safeguard ecosystems for future generations. References Boennec, M., Dakos, V. & Devictor, V. (2023). Sources of confusion in global biodiversity trend. bioRxiv, ver. 4 peer-reviewed and recommended by Peer Community in Ecology. https://doi.org/10.32942/X29W3H
| Sources of confusion in global biodiversity trends | Maelys Boennec, Vasilis Dakos, Vincent Devictor | <p>Populations and ecological communities are changing worldwide, and empirical studies exhibit a mixture of either declining or mixed trends. Confusion in global biodiversity trends thus remains while assessing such changes is of major social, po... | | Biodiversity, Conservation biology, Meta-analyses | Paulo Borges | 2023-09-20 11:10:25 | ||
03 Oct 2023
Integrating biodiversity assessments into local conservation planning: the importance of assessing suitable data sourcesBiodiversity databases are ever more numerous, but can they be used reliably for Species Distribution Modelling?Recommended by Nicolas Schtickzelle based on reviews by 2 anonymous reviewers
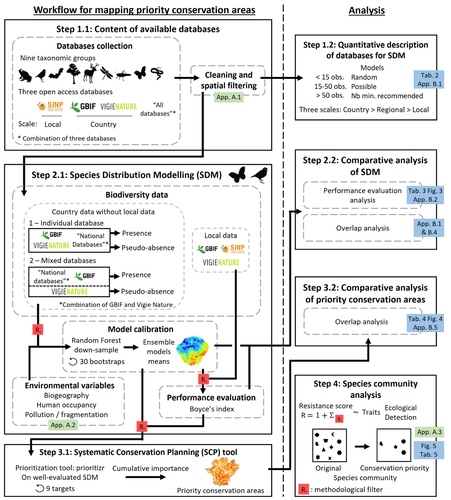
Proposing efficient guidelines for biodiversity conservation often requires the use of forecasting tools. Species Distribution Models (SDM) are more and more used to predict how the distribution of a species will react to environmental change, including any large-scale management actions that could be implemented. Their use is also boosted by the increase of publicly available biodiversity databases[1]. The now famous aphorism by George Box "All models are wrong but some are useful"[2] very well summarizes that the outcome of a model must be adjusted to, and will depend on, the data that are used to parameterize it. The question of the reliability of using biodiversity databases to parameterize biodiversity models such as SDM –but the question would also apply to other kinds of biodiversity models, e.g. Population Viability Analysis models[3]– is key to determine the confidence that can be placed in model predictions. This point is often overlooked by some categories of biodiversity conservation stakeholders, in particular the fact that some data were collected using controlled protocols while others are opportunistic. In this study[4], the authors use a collection of databases covering a range of species as well as of geographic scales in France and using different data collection and validation approaches as a case study to evaluate the impact of data quality when performing Strategic Environmental Assessment (SEA). Among their conclusions, the fact that a large-scale database (what they call the “country” level) is necessary to reliably parameterize SDM. Besides this and other conclusions of their study, which are likely to be in part specific to their case study –unfortunately for its conservation, biodiversity is complex and varies a lot–, the merit of this work lies in the approach used to test the impact of data on model predictions. References 1. Feng, X. et al. A review of the heterogeneous landscape of biodiversity databases: Opportunities and challenges for a synthesized biodiversity knowledge base. Global Ecology and Biogeography 31, 1242–1260 (2022). https://doi.org/10.1111/geb.13497 2. Box, G. E. P. Robustness in the Strategy of Scientific Model Building. in Robustness in Statistics (eds. Launer, R. L. & Wilkinson, G. N.) 201–236 (Academic Press, 1979). https://doi.org/10.1016/B978-0-12-438150-6.50018-2. 3. Beissinger, S. R. & McCullough, D. R. Population Viability Analysis. (The University of Chicago Press, 2002). 4. Ferraille, T., Kerbiriou, C., Bigard, C., Claireau, F. & Thompson, J. D. (2023) Integrating biodiversity assessments into local conservation planning: the importance of assessing suitable data sources. bioRxiv, ver. 3 peer-reviewed and recommended by Peer Community in Ecology. https://doi.org/10.1101/2023.05.09.539999 | Integrating biodiversity assessments into local conservation planning: the importance of assessing suitable data sources | Thibaut Ferraille, Christian Kerbiriou, Charlotte Bigard, Fabien Claireau, John D. Thompson | <p>Strategic Environmental Assessment (SEA) of land-use planning is a fundamental tool to minimize environmental impacts of artificialization. In this context, Systematic Conservation Planning (SCP) tools based on Species Distribution Models (SDM)... | | Biodiversity, Conservation biology, Species distributions, Terrestrial ecology | Nicolas Schtickzelle | 2023-05-11 09:41:05 | ||
11 Oct 2023

Identification of microbial exopolymer producers in sandy and muddy intertidal sediments by compound-specific isotope analysisDisentangling microbial exopolymer dynamics in intertidal sedimentsRecommended by Ute Risse-Buhl and Nils Rädecker based on reviews by 2 anonymous reviewers
The secretion of extracellular polymeric substances (EPS) enables microorganisms to shape and interact with their environment [1]. EPS support cell adhesion and motility, offer protection from unfavorable conditions, and facilitate nutrient acquisition and transfer between microorganisms [2]. EPS production and consumption thus control the formation and structural organization of biofilms [3]. However, in marine environments, our understanding of the sources and composition of EPS is limited. References
| Identification of microbial exopolymer producers in sandy and muddy intertidal sediments by compound-specific isotope analysis | Cédric Hubas, Julie Gaubert-Boussarie, An-Sofie D’Hondt, Bruno Jesus, Dominique Lamy, Vona Meleder, Antoine Prins, Philippe Rosa, Willem Stock, Koen Sabbe | <p style="text-align: justify;">Extracellular polymeric substances (EPS) refer to a wide variety of high molecular weight molecules secreted outside the cell membrane by biofilm microorganisms. In the present study, EPS from marine microphytobenth... | | Biodiversity, Ecological stoichiometry, Ecosystem functioning, Food webs, Marine ecology, Microbial ecology & microbiology, Soil ecology | Ute Risse-Buhl | 2022-12-06 14:13:11 | ||
28 Dec 2022

Deleterious effects of thermal and water stresses on life history and physiology: a case study on woodlouseAn experimental approach for understanding how terrestrial isopods respond to environmental stressorsRecommended by Aniruddha Belsare based on reviews by Aaron Yilmaz and Michael Morris
In this article, the authors discuss the results of their study investigating the effects of heat stress and moisture stress on a terrestrial isopod Armadilldium vulgare, the common woodlouse [1]. Specifically, the authors have assessed how increased temperature or decreased moisture affects life history traits (such as growth, survival, and reproduction) as well as physiological traits (immune cell parameters and \( beta \)-galactosidase activity). This article quantitatively evaluates the effects of the two stressors on woodlouse. Terrestrial isopods like woodlouse are sensitive to thermal and moisture stress [2; 3] and are therefore good models to test hypotheses in global change biology and for monitoring ecosystem health. An important feature of this study is the combination of experimental, laboratory, and analytical techniques. Experiments were conducted under controlled conditions in the laboratory by modulating temperature and moisture, life history and physiological traits were measured/analyzed and then tested using models. Both stressors had negative impacts on survival and reproduction of woodlouse, and result in premature ageing. Although thermal stress did not affect survival, it slowed woodlouse growth. Moisture stress did not have a detectable effect on woodlouse growth but decreased survival and reproductive success. An important insight from this study is that effects of heat and moisture stressors on woodlouse are not necessarily linear, and experimental approaches can be used to better elucidate the mechanisms and understand how these organisms respond to environmental stress. This article is timely given the increasing attention on biological monitoring and ecosystem health. References: [1] Depeux C, Branger A, Moulignier T, Moreau J, Lemaître J-F, Dechaume-Moncharmont F-X, Laverre T, Pauhlac H, Gaillard J-M, Beltran-Bech S (2022) Deleterious effects of thermal and water stresses on life history and physiology: a case study on woodlouse. bioRxiv, 2022.09.26.509512., ver. 3 peer-reviewd and recommended by PCI Ecology. https://doi.org/10.1101/2022.09.26.509512 [2] Warburg MR, Linsenmair KE, Bercovitz K (1984) The effect of climate on the distribution and abundance of isopods. In: Sutton SL, Holdich DM, editors. The Biology of Terrestrial Isopods. Oxford: Clarendon Press. pp. 339–367. [3] Hassall M, Helden A, Goldson A, Grant A (2005) Ecotypic differentiation and phenotypic plasticity in reproductive traits of Armadillidium vulgare (Isopoda: Oniscidea). Oecologia 143: 51–60. https://doi.org/10.1007/s00442-004-1772-3 | Deleterious effects of thermal and water stresses on life history and physiology: a case study on woodlouse | Charlotte Depeux, Angele Branger, Theo Moulignier, Jérôme Moreau, Jean-Francois Lemaitre, Francois-Xavier Dechaume-Moncharmont, Tiffany Laverre, Hélène Paulhac, Jean-Michel Gaillard, Sophie Beltran-Bech | <p>We tested independently the influences of increasing temperature and decreasing moisture on life history and physiological traits in the arthropod <em>Armadillidium vulgare</em>. Both increasing temperature and decreasing moisture led individua... | | Biodiversity, Evolutionary ecology, Experimental ecology, Life history, Physiology, Terrestrial ecology, Zoology | Aniruddha Belsare | 2022-09-28 13:13:47 | ||
28 Mar 2024

Changes in length-at-first return of a sea trout (Salmo trutta) population in northern FranceWhy are trout getting smaller?Recommended by Aleksandra Walczyńska based on reviews by Jan Kozlowski and 1 anonymous reviewerDecline in body size over time have been widely observed in fish (but see Solokas et al. 2023), and the ecological consequences of this pattern can be severe (e.g., Audzijonyte et al. 2013, Oke et al. 2020). Therefore, studying the interrelationships between life history traits to understand the causal mechanisms of this pattern is timely and valuable. This phenomenon was the subject of a study by Josset et al. (2024), in which the authors analysed data from 39 years of trout trapping in the Bresle River in France. The authors focused mainly on the length of trout on their first return from the sea. The most important results of the study were the decrease in fish length-at-first return and the change in the age structure of first-returning trout towards younger (and earlier) returning fish. It seems then that the smaller size of trout is caused by a shorter time spent in the sea rather than a change in a growth pattern, as length-at-age remained relatively constant, at least for those returning earlier. Fish returning after two years spent in the sea had a relatively smaller length-at-age. The authors suggest this may be due to local changes in conditions during fish's stay in the sea, although there is limited environmental data to confirm the causal effect. Another question is why there are fewer of these older fish. The authors point to possible increased mortality from disease and/or overfishing. These results may suggest that the situation may be getting worse, as another study finding was that “the more growth seasons an individual spent at sea, the greater was its length-at-first return.” The consequences may be the loss of the oldest and largest individuals, whose disproportionately high reproductive contribution to the population is only now understood (Barneche et al. 2018, Marshall and White 2019). Audzijonyte, A. et al. 2013. Ecological consequences of body size decline in harvested fish species: positive feedback loops in trophic interactions amplify human impact. Biol Lett 9, 20121103. https://doi.org/10.1098/rsbl.2012.1103 Oke, K. B. et al. 2020. Recent declines in salmon body size impact ecosystems and fisheries. Nature Communications, 11, 4155. https://doi.org/10.1038/s41467-020-17726-z Solokas, M. A. et al. 2023. Shrinking body size and climate warming: many freshwater salmonids do not follow the rule. Global Change Biology, 29, 2478-2492. https://doi.org/10.1111/gcb.16626 | Changes in length-at-first return of a sea trout (*Salmo trutta*) population in northern France | Quentin Josset, Laurent Beaulaton, Atso Romakkaniemi, Marie Nevoux | <p style="text-align: justify;">The resilience of sea trout populations is increasingly concerning, with evidence of major demographic changes in some populations. Based on trapping data and related scale collection, we analysed long-term changes ... | | Biodiversity, Evolutionary ecology, Freshwater ecology, Life history, Marine ecology | Aleksandra Walczyńska | 2023-11-23 14:36:39 | ||
28 Apr 2023
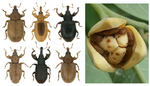
Most diverse, most neglected: weevils (Coleoptera: Curculionoidea) are ubiquitous specialized brood-site pollinators of tropical floraPollination-herbivory by weevils claiming for recognition: the Cinderella among pollinatorsRecommended by Juan Arroyo based on reviews by Susan Kirmse, Carlos Eduardo Nunes and 2 anonymous reviewersSince Charles Darwin times, and probably earlier, naturalists have been eager to report the rarest pollinators being discovered, and this still happens even in recent times; e.g., increased evidence of lizards, cockroaches, crickets or earwigs as pollinators (Suetsugu 2018, Komamura et al. 2021, de Oliveira-Nogueira et al. 2023), shifts to invasive animals as pollinators, including passerine birds and rats (Pattemore & Wilcove 2012), new amazing cases of mimicry in pollination, such as “bleeding” flowers that mimic wounded insects (Heiduk et al., 2023) or even the possibility that a tree frog is reported for the first time as a pollinator (de Oliveira-Nogueira et al. 2023). This is in part due to a natural curiosity of humans about rarity, which pervades into scientific insight (Gaston 1994). Among pollinators, the apparent rarity of some interaction types is sometimes a symptom of a lack of enough inquiry. This seems to be the case of weevil pollination, given that these insects are widely recognized as herbivores, particularly those that use plant parts to nurse their breed and never were thought they could act also as mutualists, pollinating the species they infest. This is known as a case of brood site pollination mutualism (BSPM), which also involves an antagonistic counterpart (herbivory) to which plants should face. This is the focus of the manuscript (Haran et al. 2023) we are recommending here. There is wide treatment of this kind of pollination in textbooks, albeit focused on yucca-yucca moth and fig-fig wasp interactions due to their extreme specialization (Pellmyr 2003, Kjellberg et al. 2005), and more recently accompanied by Caryophyllaceae-moth relationship (Kephart et al. 2006). Here we find a detailed review that shows that the most diverse BSPM, in terms of number of plant and pollinator species involved, is that of weevils in the tropics. The mechanism of BSPM does not involve a unique morphological syndrome, as it is mostly functional and thus highly dependent on insect biology (Fenster & al. 2004), whereas the flower phenotypes are highly divergent among species. Probably, the inconspicuous nature of the interaction, and the overwhelming role of weevils as seed predators, even as pests, are among the causes of the neglection of weevils as pollinators, as it could be in part the case of ants as pollinators (de Vega et al. 2014). The paper by Haran et al (2023) comes to break this point. Thus, the rarity of weevil pollination in former reports is not a consequence of an anecdotical nature of this interaction, even for the BSPM, according to the number of cases the authors are reporting, both in terms of plant and pollinator species involved. This review has a classical narrative format which involves a long text describing the natural history behind the cases. It is timely and fills the gap for this important pollination interaction for biodiversity and also for economic implications for fruit production of some crops. Former reviews have addressed related topics on BSPM but focused on other pollinators, such as those mentioned above. Besides, the review put much effort into the animal side of the interaction, which is not common in the pollination literature. Admittedly, the authors focus on the detailed description of some paradigmatic cases, and thereafter suggest that these can be more frequently reported in the future, based on varied evidence from morphology, natural history, ecology, and distribution of alleged partners. This procedure was common during the development of anthecology, an almost missing term for floral ecology (Baker 1983), relying on accumulative evidence based on detailed observations and experiments on flowers and pollinators. Currently, a quantitative approach based on the tools of macroecological/macroevolutionary analyses is more frequent in reviews. However, this approach requires a high amount of information on the natural history of the partnership, which allows for sound hypothesis testing. By accumulating this information, this approach allows the authors to pose specific questions and hypotheses which can be tested, particularly on the efficiency of the systems and their specialization degree for both the plants and the weevils, apparently higher for the latter. This will guarantee that this paper will be frequently cited by floral ecologists and evolutionary biologists and be included among the plethora of floral syndromes already described, currently based on more explicit functional grounds (Fenster et al. 2004). In part, this is one of the reasons why the sections focused on future prospects is so large in the review. I foresee that this mutualistic/antagonistic relationship will provide excellent study cases for the relative weight of these contrary interactions among the same partners and its relationship with pollination specialization-generalization and patterns of diversification in the plants and/or the weevils. As new studies are coming, it is possible that BSPM by weevils appears more common in non-tropical biogeographical regions. In fact, other BSPM are not so uncommon in other regions (Prieto-Benítez et al. 2017). In the future, it would be desirable an appropriate testing of the actual effect of phylogenetic niche conservatism, using well known and appropriately selected BSPM cases and robust phylogenies of both partners in the mutualism. Phylogenetic niche conservatism is a central assumption by the authors to report as many cases as possible in their review, and for that they used taxonomic relatedness. As sequence data and derived phylogenies for large numbers of vascular plant species are becoming more frequent (Jin & Quian 2022), I would recommend the authors to perform a comparative analysis using this phylogenetic information. At least, they have included information on phylogenetic relatedness of weevils involved in BSPM which allow some inferences on the multiple origins of this interaction. This is a good start to explore the drivers of these multiple origins through the lens of comparative biology. References Baker HG (1983) An Outline of the History of Anthecology, or Pollination Biology. In: L Real (ed). Pollination Biology. Academic Press. de-Oliveira-Nogueira CH, Souza UF, Machado TM, Figueiredo-de-Andrade CA, Mónico AT, Sazima I, Sazima M, Toledo LF (2023). Between fruits, flowers and nectar: The extraordinary diet of the frog Xenohyla truncate. Food Webs 35: e00281. https://doi.org/10.1016/j.fooweb.2023.e00281 Fenster CB W, Armbruster S, Wilson P, Dudash MR, Thomson JD (2004). Pollination syndromes and floral specialization. Annu. Rev. Ecol. Evol. Syst. 35: 375–403. https://doi.org/10.1146/annurev.ecolsys.34.011802.132347 Gaston KJ (1994). What is rarity? In KJ Gaston (ed): Rarity. Population and Community Biology Series, vol 13. Springer, Dordrecht. https://doi.org/10.1007/978-94-011-0701-3_1 Haran J, Kergoat GJ, Bruno, de Medeiros AS (2023) Most diverse, most neglected: weevils (Coleoptera: Curculionoidea) are ubiquitous specialized brood-site pollinators of tropical flora. hal. 03780127, version 2 peer-reviewed and recommended by Peer Community in Ecology. https://hal.inrae.fr/hal-03780127 Heiduk A, Brake I, Shuttleworth A, Johnson SD (2023) ‘Bleeding’ flowers of Ceropegia gerrardii (Apocynaceae-Asclepiadoideae) mimic wounded insects to attract kleptoparasitic fly pollinators. New Phytologist. https://doi.org/10.1111/nph.18888 Jin, Y., & Qian, H. (2022). V. PhyloMaker2: An updated and enlarged R package that can generate very large phylogenies for vascular plants. Plant Diversity, 44(4), 335-339. https://doi.org/10.1016/j.pld.2022.05.005 Kjellberg F, Jousselin E, Hossaert-Mckey M, Rasplus JY (2005). Biology, ecology, and evolution of fig-pollinating wasps (Chalcidoidea, Agaonidae). In: A. Raman et al (eds) Biology, ecology and evolution of gall-inducing arthropods 2, 539-572. Science Publishers, Enfield. Komamura R, Koyama K, Yamauchi T, Konno Y, Gu L (2021). Pollination contribution differs among insects visiting Cardiocrinum cordatum flowers. Forests 12: 452. https://doi.org/10.3390/f12040452 Pattemore DE, Wilcove DS (2012) Invasive rats and recent colonist birds partially compensate for the loss of endemic New Zealand pollinators. Proc. R. Soc. B 279: 1597–1605. https://doi.org/10.1098/rspb.2011.2036 Pellmyr O (2003) Yuccas, yucca moths, and coevolution: a review. Ann. Missouri Bot. Gard. 90: 35-55. https://doi.org/10.2307/3298524 Prieto-Benítez S, Yela JL, Giménez-Benavides L (2017) Ten years of progress in the study of Hadena-Caryophyllaceae nursery pollination. A review in light of new Mediterranean data. Flora, 232, 63-72. https://doi.org/10.1016/j.flora.2017.02.004 Suetsugu K (2019) Social wasps, crickets and cockroaches contribute to pollination of the holoparasitic plant Mitrastemon yamamotoi (Mitrastemonaceae) in southern Japan. Plant Biology 21 176–182. https://doi.org/10.1111/plb.12889 | Most diverse, most neglected: weevils (Coleoptera: Curculionoidea) are ubiquitous specialized brood-site pollinators of tropical flora | Julien Haran, Gael J. Kergoat, Bruno A. S. de Medeiros | <p style="text-align: justify;">In tropical environments, and especially tropical rainforests, a major part of pollination services is provided by diverse insect lineages. Unbeknownst to most, beetles, and more specifically hyperdiverse weevils (C... | | Biodiversity, Evolutionary ecology, Pollination, Tropical ecology | Juan Arroyo | 2022-09-28 11:54:37 | ||
01 Mar 2022
Dissimilarity of species interaction networks: quantifying the effect of turnover and rewiringHow to evaluate and interpret the contribution of species turnover and interaction rewiring when comparing ecological networks?Recommended by François Munoz based on reviews by Ignasi Bartomeus and 1 anonymous reviewer
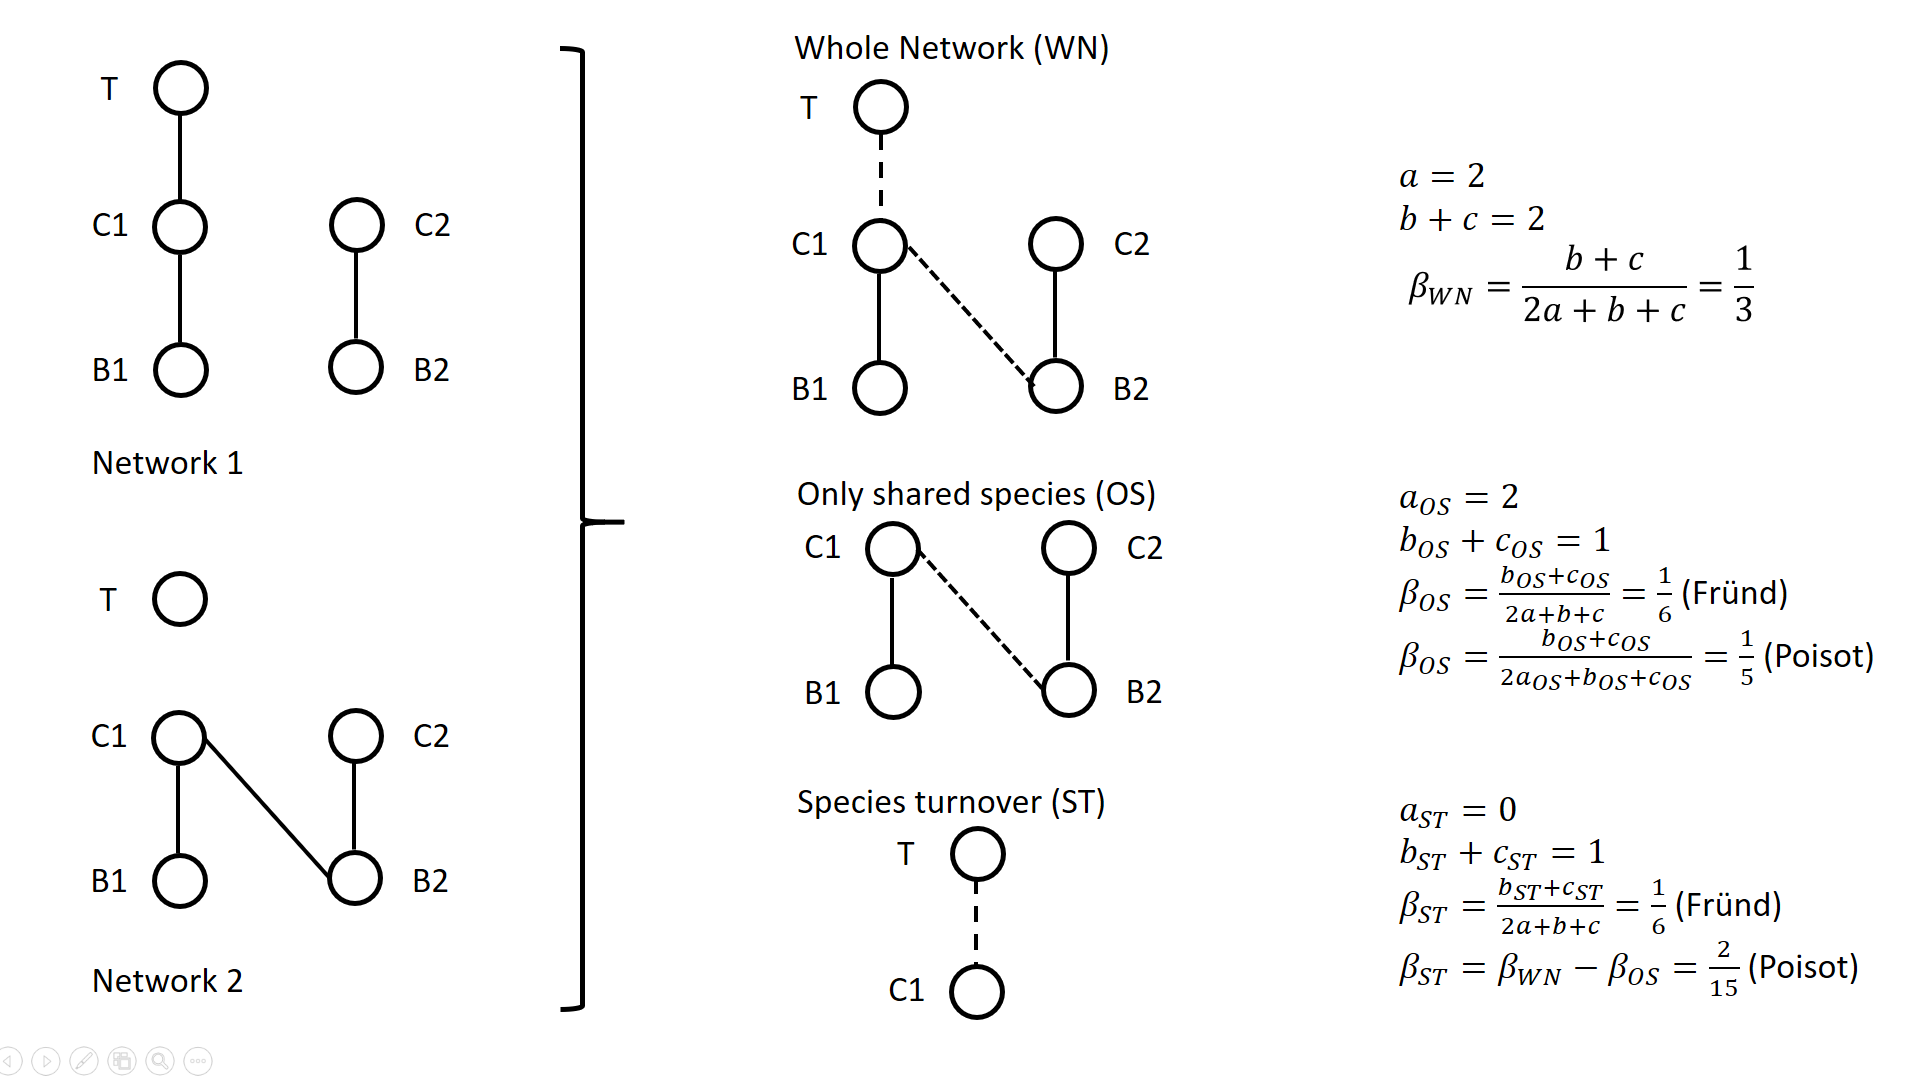
A network includes a set of vertices or nodes (e.g., species in an interaction network), and a set of edges or links (e.g., interactions between species). Whether and how networks vary in space and/or time are questions often addressed in ecological research. Two ecological networks can differ in several extents: in that species are different in the two networks and establish new interactions (species turnover), or in that species that are present in both networks establish different interactions in the two networks (rewiring). The ecological meaning of changes in network structure is quite different according to whether species turnover or interaction rewiring plays a greater role. Therefore, much attention has been devoted in recent years on quantifying and interpreting the relative changes in network structure due to species turnover and/or rewiring. Poisot et al. (2012) proposed to partition the global variation in structure between networks, \( \beta_{WN} \) (WN = Whole Network) into two terms: \( \beta_{OS} \) (OS = Only Shared species) and \( \beta_{ST} \) (ST = Species Turnover), such as \( \beta_{WN} = \beta_{OS} + \beta_{ST} \). The calculation lays on enumerating the interactions between species that are common or not to two networks, as illustrated on Figure 1 for a simple case. Specifically, Poisot et al. (2012) proposed to use a Sorensen type measure of network dissimilarity, i.e., \( \beta_{WN} = \frac{a+b+c}{(2a+b+c)/2} -1=\frac{b+c}{2a+b+c} \) , where \( a \) is the number of interactions shared between the networks, while \( b \) and \( c \) are interaction numbers unique to one and the other network, respectively. \( \beta_{OS} \) is calculated based on the same formula, but only for the subnetworks including the species common to the two networks, in the form \( \beta_{OS} = \frac{b_{OS}+c_{OS}}{2a_{OS}+b_{OS}+c_{OS}} \) (e.g., Fig. 1). \( \beta_{ST} \) is deduced by subtracting \( \beta_{OS} \) from \( \beta_{WN} \) and represents in essence a "dissimilarity in interaction structure introduced by dissimilarity in species composition" (Poisot et al. 2012).
Figure 1. Ecological networks exemplified in Fründ (2021) and discussed in Poisot (2022). a is the number of shared links (continuous lines in right figures), while b+c is the number of edges unique to one or the other network (dashed lines in right figures). Alternatively, Fründ (2021) proposed to define \( \beta_{OS} = \frac{b_{OS}+c_{OS}}{2a+b+c} \) and \( \beta_{ST} = \frac{b_{ST}+c_{ST}}{2a+b+c} \), where \( b_{ST}=b-b_{OS} \) and \( c_{ST}=c-c_{OS} \) , so that the components \( \beta_{OS} \) and \( \beta_{ST} \) have the same denominator. In this way, Fründ (2021) partitioned the count of unique \( b+c=b_{OS}+b_{ST}+c_{ST} \) interactions, so that \( \beta_{OS} \) and \( \beta_{ST} \) sums to \( \frac{b_{OS}+c_{OS}+b_{ST}+c_{ST}}{2a+b+c} = \frac{b+c}{2a+b+c} = \beta_{WN} \). Fründ (2021) advocated that this partition allows a more sensible comparison of \( \beta_{OS} \) and \( \beta_{ST} \), in terms of the number of links that contribute to each component. For instance, let us consider the networks 1 and 2 in Figure 1 (left panel) such as \( a_{OS}=2 \) (continuous lines in right panel), \( b_{ST} + c_{ST} = 1 \) and \( b_{OS} + c_{OS} = 1 \) (dashed lines in right panel), and thereby \( a = 2 \), \( b+c=2 \), \( \beta_{WN} = 1/3 \). Fründ (2021) measured \( \beta_{OS}=\beta_{ST}=1/6 \) and argued that it is appropriate insofar as it reflects that the number of unique links in the OS and ST components contributing to network dissimilarity (dashed lines) are actually equal. Conversely, the formula of Poisot et al. (2012) yields \( \beta_{OS}=1/5 \), hence \( \beta_{ST} = \frac{1}{3}-\frac{1}{5}=\frac{2}{15}<\beta_{OS} \). Fründ (2021) thus argued that the method of Poisot tends to underestimate the contribution of species turnover. To clarify and avoid misinterpretation of the calculation of \( \beta_{OS} \) and \( \beta_{ST} \) in Poisot et al. (2012), Poisot (2022) provides a new, in-depth mathematical analysis of the decomposition of \( \beta_{WN} \). Poisot et al. (2012) quantify in \( \beta_{OS} \) the actual contribution of rewiring in network structure for the subweb of common species. Poisot (2022) thus argues that \( \beta_{OS} \) relates only to the probability of rewiring in the subweb, while the definition of \( \beta_{OS} \) by Fründ (2021) is relative to the count of interactions in the global network (considered in denominator), and is thereby dependent on both rewiring probability and species turnover. Poisot (2022) further clarifies the interpretation of \( \beta_{ST} \). \( \beta_{ST} \) is obtained by subtracting \( \beta_{OS} \) from \( \beta_{WN} \) and thus represents the influence of species turnover in terms of the relative architectures of the global networks and of the subwebs of shared species. Coming back to the example of Fig.1., the Poisot et al. (2012) formula posits that \( \frac{\beta_{ST}}{\beta_{WN}}=\frac{2/15}{1/3}=2/5 \), meaning that species turnover contributes two-fifths of change in network structure, while rewiring in the subweb of common species contributed three fifths. Conversely, the approach of Fründ (2021) does not compare the architectures of global networks and of the subwebs of shared species, but considers the relative contribution of unique links to network dissimilarity in terms of species turnover and rewiring. Poisot (2022) concludes that the partition proposed in Fründ (2021) does not allow unambiguous ecological interpretation of rewiring. He provides guidelines for proper interpretation of the decomposition proposed in Poisot et al. (2012). References Fründ J (2021) Dissimilarity of species interaction networks: how to partition rewiring and species turnover components. Ecosphere, 12, e03653. https://doi.org/10.1002/ecs2.3653 Poisot T, Canard E, Mouillot D, Mouquet N, Gravel D (2012) The dissimilarity of species interaction networks. Ecology Letters, 15, 1353–1361. https://doi.org/10.1111/ele.12002 Poisot T (2022) Dissimilarity of species interaction networks: quantifying the effect of turnover and rewiring. EcoEvoRxiv Preprints, ver. 4 peer-reviewed and recommended by Peer Community in Ecology. https://doi.org/10.32942/osf.io/gxhu2 | Dissimilarity of species interaction networks: quantifying the effect of turnover and rewiring | Timothée Poisot | <p style="text-align: justify;">Despite having established its usefulness in the last ten years, the decomposition of ecological networks in components allowing to measure their β-diversity retains some methodological ambiguities. Notably, how to ... | | Biodiversity, Interaction networks, Theoretical ecology | François Munoz | 2021-07-31 00:18:41 | ||
03 Jan 2024
Efficient sampling designs to assess biodiversity spatial autocorrelation : should we go fractal?Spatial patterns and autocorrelation challenges in ecological conservationRecommended by Eric Goberville based on reviews by Nigel Yoccoz and Charles J Marsh
“Pattern, like beauty, is to some extent in the eye of the beholder” (Grant 1977 in Wiens, 1989) Ecologists are immersed in unraveling the complex spatial patterns that govern species diversity, driven by both practical and theoretical imperatives (Rahbek, 2005; Wang et al., 2019). This dual focus necessitates a practical imperative for strategic biodiversity conservation, requiring a nuanced understanding of locations with peak species richness and dynamic shifts in species assemblages (Chase et al., 2020). Simultaneously, there is a theoretical interest in using diversity patterns as empirical testing grounds for theories explaining factors influencing diversity disparities and the associated increase in species turnover correlated with inter-site distance (Condit et al., 2002).
McGill (2010), in his paper "Matters of Scale", highlights the scale-dependent nature of ecology, aligning with the recognition that spatial autocorrelation is inherent in biogeographical data and often correlated with sample size (Rahbek, 2005). Spatial autocorrelation, often underestimated in ecological studies (Dormann, 2007), occurs when proximate locations exhibit similarities in ecological attributes (Tobler, 1970; Getis, 2010), introducing a latent bias that compromises the robustness of ecological findings (Dormann, 2007; Dormann et al., 2007). This phenomenon serves as both an asset, providing valuable information for inferring processes from patterns (Palma et al. 1999), and a challenge, imposing limitations on hypothesis testing and prediction (Dormann et al., 2007 and references therein). Various factors contribute to spatial autocorrelation, with three primary contributors (Dormann et al., 2007; Legendre, 1993; Legendre and Fortin, 1989; Legendre and Legendre, 2012): (i) distance-related effects in biological processes, (ii) misrepresentation of non-linear relationships between the environment and species as linear and (iii) the oversight of a crucial spatially structured environmental determinant in the statistical model, leading to spatial structuring in the response (Dormann et al., 2007).
Recognising the pivotal role of spatial heterogeneity in ecological theories (Wang et al., 2019), it becomes imperative to discern and address the limitations introduced by spatial autocorrelation (Legendre, 1993). McGill (2011) emphasises that the ultimate goal of biodiversity pattern studies should be to develop a quantitative predictive theory useful for conservation. The spatial dimension's importance in study planning, determining the system's scale, appropriate quadrat size, and spacing between sampling stations, is paramount (Fortin, 1999a,b). Responses to these considerations are intricately linked with study objectives and insights from pre-sampling campaigns, underscoring the need for a nuanced and rigorous approach (Delmelle, 2021).
Understanding statistical techniques and nested sampling designs is crucial to answering fundamental ecological questions (Dormann et al., 2007; McDonald, 2012). In addressing spatial autocorrelation challenges, ecologists must recognize the limitations of many standard statistical methods in ecological studies (Dale and Fortin, 2002; Legendre and Fortin, 1989; Steel et al., 2013). In the initial phases of description or hypothesis generation, ecologists should proactively acknowledge the spatial structure in their data and conduct tests for spatial autocorrelation (for a comprehensive description, see Legendre and Fortin, 1989): various tools, including correlograms, spectral analysis, the Mantel test, and clustering methods, facilitate the assessment and description of spatial structures. The partial Mantel test enables the study of causal models with space as an explanatory variable. Techniques for mapping ecological variables, such as interpolation, trend surface analysis, and constrained clustering, yield maps providing valuable insights into the spatial dynamics of ecological systems.
This refined consideration of spatial autocorrelation emerges as an imperative in ecological research, fostering a deeper and more precise understanding of the intricate interplay between species diversity, spatial patterns, and the inherent limitations imposed by spatial autocorrelation (Legendre et al., 2002). This not only contributes significantly to the scientific discourse in ecology but also aligns with McGill's vision of developing predictive theories for effective conservation (Bacaro et al., 2016; McGill, 2011).
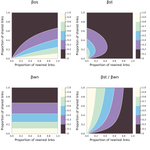
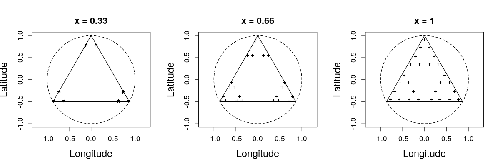
In this study by Fabien Laroche (2023), titled “Efficient sampling designs to assess biodiversity spatial autocorrelation: should we go fractal?” the primary focus was on addressing the challenges associated with estimating the autocorrelation range of species distribution across spatial scales. The study aimed to explore alternative sampling designs, with a particular focus on the application of fractal designs—self-similar designs with well-identified scales. The overarching goal was to evaluate whether fractal designs could offer a more efficient compromise compared to traditional hybrid designs, which involve mixing random sampling points with a systematic grid.
Virtual ecology provides a way to test whether sampling designs can accurately detect or quantify effects of interest before implementing them in the field. Beyond the question of assessing the power of empirical designs, a virtual ecology analysis contributes to clearly formulating the set of questions associated with a design. However, only a few virtual studies have focused on efficient designs to accurately estimate the autocorrelation range of biodiversity variables. In this study, the statistical framework of optimal design of experiments was employed—a methodology often used in building and comparing designs of temporal or spatiotemporal biodiversity surveys but rarely applied to the specific problem of quantifying spatial autocorrelation.
Key findings from the study shed light on optimal sampling strategies, with a notable dependence on the feasible grid mesh size over the study area in relation to expected autocorrelation range values. The results demonstrated that the efficiency of designs varied based on the specific effect under study. Fractal designs, however, exhibited superior performance, particularly when assessing the effect of a monotonic environmental gradient across space.
In conclusion, the study provides valuable insights into the potential benefits of incorporating fractal designs in biodiversity studies, offering a nuanced and efficient approach to estimate spatial autocorrelation. These findings contribute significantly to the ongoing scientific discourse in ecology, providing practical considerations for improving sampling designs in biodiversity assessments.
References
Bacaro, G., Altobelli, A., Cameletti, M., Ciccarelli, D., Martellos, S., Palmer, M.W., Ricotta, C., Rocchini, D., Scheiner, S.M., Tordoni, E., Chiarucci, A., 2016. Incorporating spatial autocorrelation in rarefaction methods: Implications for ecologists and conservation biologists. Ecological Indicators 69, 233-238. https://doi.org/10.1016/j.ecolind.2016.04.026
Chase, J.M., Jeliazkov, A., Ladouceur, E., Viana, D.S., 2020. Biodiversity conservation through the lens of metacommunity ecology. Annals of the New York Academy of Sciences 1469, 86-104. https://doi.org/10.1111/nyas.14378
Condit, R., Pitman, N., Leigh, E.G., Chave, J., Terborgh, J., Foster, R.B., Núñez, P., Aguilar, S., Valencia, R., Villa, G., Muller-Landau, H.C., Losos, E., Hubbell, S.P., 2002. Beta-Diversity in Tropical Forest Trees. Science 295, 666-669. https://doi.org/10.1126/science.1066854
Dale, M.R.T., Fortin, M.-J., 2002. Spatial autocorrelation and statistical tests in ecology. Écoscience 9, 162-167. https://doi.org/10.1080/11956860.2002.11682702
Delmelle, E.M., 2021. Spatial Sampling, in: Fischer, M.M., Nijkamp, P. (Eds.), Handbook of Regional Science. Springer Berlin Heidelberg, Berlin, Heidelberg, pp. 1829-1844.
Dormann, C.F., 2007. Effects of incorporating spatial autocorrelation into the analysis of species distribution data. Global Ecology & Biogeography 16, 129-128. https://doi.org/10.1111/j.1466-8238.2006.00279.x
Dormann, C.F., McPherson, J.M., Araújo, M.B., Bivand, R., Bolliger, J., Carl, G., Davies, R.G., Hirzel, A., Jetz, W., Kissling, W.D., Kühn, I., Ohlemüler, R., Peres-Neto, P.R., Reineking, B., Schröder, B., Schurr, F.M., Wilson, R., 2007. Methods to account for spatial autocorrelation in the analysis of species distributional data: a review. Ecography 33, 609-628. https://doi.org/10.1111/j.2007.0906-7590.05171.x
Fortin, M.-J., 1999a. Effects of quadrat size and data measurement on the detection of boundaries. Journal of Vegetation Science 10, 43-50. https://doi.org/10.2307/3237159
Fortin, M.-J., 1999b. Effects of sampling unit resolution on the estimation of spatial autocorrelation. Écoscience 6, 636-641. https://doi.org/10.1080/11956860.1999.11682547
Getis, A., 2010. Spatial Autocorrelation, in: Fischer, M.M., Getis, A. (Eds.), Handbook of Applied Spatial Analysis: Software Tools, Methods and Applications. Springer Berlin Heidelberg, Berlin, Heidelberg, pp. 255-278.
Laroche, F., 2023. Efficient sampling designs to assess biodiversity spatial autocorrelation: should we go fractal? bioRxiv, 2022.07.29.501974, ver. 4 peer-reviewed and recommended by Peer Community in Ecology. https://doi.org/10.1101/2022.07.29.501974
Legendre, P., 1993. Spatial Autocorrelation: Trouble or New Paradigm? Ecology 74, 1659-1673. https://doi.org/10.2307/1939924
Legendre, P., Dale, M.R.T., Fortin, M.-J., Gurevitch, J., Hohn, M., Myers, D., 2002. The consequences of spatial structure for the design and analysis of ecological field surveys. Ecography 25, 601-615. https://doi.org/10.1034/j.1600-0587.2002.250508.x
Legendre, P., Fortin, M.J., 1989. Spatial pattern and ecological analysis. Vegetatio 80, 107-138. https://doi.org/10.1007/BF00048036
Legendre, P., Legendre, L., 2012. Numerical Ecology, Third Edition ed. Elsevier, The Netherlands.
McDonald, T., 2012. Spatial sampling designs for long-term ecological monitoring, in: Cooper, A.B., Gitzen, R.A., Licht, D.S., Millspaugh, J.J. (Eds.), Design and Analysis of Long-term Ecological Monitoring Studies. Cambridge University Press, Cambridge, pp. 101-125.
McGill, B.J., 2010. Matters of Scale. Science 328, 575-576. https://doi.org/10.1126/science.1188528
McGill, B.J., 2011. Linking biodiversity patterns by autocorrelated random sampling. American Journal of Botany 98, 481-502. https://doi.org/10.3732/ajb.1000509
Rahbek, C., 2005. The role of spatial scale and the perception of large-scale species-richness patterns. Ecology Letters 8, 224-239. https://doi.org/10.1111/j.1461-0248.2004.00701.x
Steel, E.A., Kennedy, M.C., Cunningham, P.G., Stanovick, J.S., 2013. Applied statistics in ecology: common pitfalls and simple solutions. Ecosphere 4, art115. https://doi.org/10.1890/ES13-00160.1
Tobler, W.R., 1970. A Computer Movie Simulating Urban Growth in the Detroit Region. Economic Geography 46, 234-240. https://doi.org/10.2307/143141
Wang, S., Lamy, T., Hallett, L.M., Loreau, M., 2019. Stability and synchrony across ecological hierarchies in heterogeneous metacommunities: linking theory to data. Ecography 42, 1200-1211. https://doi.org/10.1111/ecog.04290
Wiens, J.A., 1989. The ecology of bird communities. Cambridge University Press.
| Efficient sampling designs to assess biodiversity spatial autocorrelation : should we go fractal? | Fabien Laroche | <p>Quantifying the autocorrelation range of species distribution in space is necessary for applied ecological questions, like implementing protected area networks or monitoring programs. However, the power of spatial sampling designs to estimate t... | | Biodiversity, Landscape ecology, Spatial ecology, Metacommunities & Metapopulations, Statistical ecology | Eric Goberville | 2023-04-21 10:54:29 | ||
12 Aug 2021

A study on the role of social information sharing leading to range expansion in songbirds with large vocal repertoires: Enhancing our understanding of the Great-Tailed Grackle (Quiscalus mexicanus) alarm callDoes the active vocabulary in Great-tailed Grackles supports their range expansion? New study will find outRecommended by Jan Oliver Engler based on reviews by Guillermo Fandos and 2 anonymous reviewersAlarm calls are an important acoustic signal that can decide the life or death of an individual. Many birds are able to vary their alarm calls to provide more accurate information on e.g. urgency or even the type of a threatening predator. According to the acoustic adaptation hypothesis, the habitat plays an important role too in how acoustic patterns get transmitted. This is of particular interest for range-expanding species that will face new environmental conditions along the leading edge. One could hypothesize that the alarm call repertoire of a species could increase in newly founded ranges to incorporate new habitats and threats individuals might face. Hence selection for a larger active vocabulary might be beneficial for new colonizers. Using the Great-Tailed Grackle (Quiscalus mexicanus) as a model species, Samantha Bowser from Arizona State University and Maggie MacPherson from Louisiana State University want to find out exactly that. The Great-Tailed Grackle is an appropriate species given its high vocal diversity. Also, the species consists of different subspecies that show range expansions along the northern range edge yet to a varying degree. Using vocal experiments and field recordings the researchers have a high potential to understand more about the acoustic adaptation hypothesis within a range dynamic process. Over the course of this assessment, the authors incorporated the comments made by two reviewers into a strong revision of their research plans. With that being said, the few additional comments made by one of the initial reviewers round up the current stage this interesting research project is in. To this end, I can only fully recommend the revised research plan and am much looking forward to the outcomes from the author’s experiments, modeling, and field data. With the suggestions being made at such an early stage I firmly believe that the final outcome will be highly interesting not only to an ornithological readership but to every ecologist and biogeographer interested in drivers of range dynamic processes. References Bowser, S., MacPherson, M. (2021). A study on the role of social information sharing leading to range expansion in songbirds with large vocal repertoires: Enhancing our understanding of the Great-Tailed Grackle (Quiscalus mexicanus) alarm call. In principle recommendation by PCI Ecology. https://doi.org/10.17605/OSF.IO/2UFJ5. Version 3 | A study on the role of social information sharing leading to range expansion in songbirds with large vocal repertoires: Enhancing our understanding of the Great-Tailed Grackle (Quiscalus mexicanus) alarm call | Samantha Bowser, Maggie MacPherson | <p>The acoustic adaptation hypothesis posits that animal sounds are influenced by the habitat properties that shape acoustic constraints (Ey and Fischer 2009, Morton 2015, Sueur and Farina 2015).Alarm calls are expected to signal important habitat... | | Biogeography, Biological invasions, Coexistence, Dispersal & Migration, Habitat selection, Landscape ecology | Jan Oliver Engler | Darius Stiels, Anonymous | 2020-12-01 18:11:02 |