
Direct submissions to PCI Ecology from bioRxiv.org are possible using the B2J service
Latest recommendations

| Id | Title * | Authors * | Abstract * ▲ | Picture * | Thematic fields * | Recommender | Reviewers | Submission date | |
|---|---|---|---|---|---|---|---|---|---|
30 Mar 2020
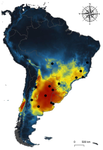
Environmental variables determining the distribution of an avian parasite: the case of the Philornis torquans complex (Diptera: Muscidae) in South AmericaCatching the fly in dystopian timesRecommended by Rodrigo Medel based on reviews by 4 anonymous reviewersHost-parasite interactions are ubiquitous on Earth. They are present in almost every conceivable ecosystem and often result from a long history of antagonist coevolution [1,2]. Recent studies on climate change have revealed, however, that modification of abiotic variables are often accompanied by shifts in the distributional range of parasites to habitats far beyond their original geographical distribution, creating new interactions in novel habitats with unpredictable consequences for host community structure and organization [3,4]. This situation may be especially critical for endangered host species having small population abundance and restricted distribution range. The infestation of bird species with larvae of the muscid fly genus Philornis is a case in point. At least 250 bird species inhabiting mostly Central and South America are infected by Philornis flies [5,6]. Fly larval development occurs in bird faeces, nesting material, or inside nestlings, affecting the development and nestling survival. References [1] Thompson JN (1994) The Coevolutionary Process. University of Chicago Press. | Environmental variables determining the distribution of an avian parasite: the case of the Philornis torquans complex (Diptera: Muscidae) in South America | Pablo F. Cuervo, Alejandro Percara, Lucas Monje, Pablo M. Beldomenico, Martín A. Quiroga | <p>*Philornis* flies are the major cause of myasis in altricial nestlings of neotropical birds. Its impact ranges from subtle to lethal, being of major concern in endangered bird species with geographically-restricted, fragmented and small-sized p... | | Biogeography, Macroecology, Parasitology, Species distributions | Rodrigo Medel | 2019-11-26 21:31:33 | ||
11 May 2020
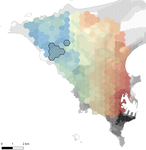
Interplay between historical and current features of the cityscape in shaping the genetic structure of the house mouse (Mus musculus domesticus) in Dakar (Senegal, West Africa)Urban past predicts contemporary genetic structure in city ratsRecommended by Michelle DiLeo based on reviews by Torsti Schulz, ? and 1 anonymous reviewerUrban areas are expanding worldwide, and have become a dominant part of the landscape for many species. Urbanization can fragment pre-existing populations of vulnerable species leading to population declines and the loss of connectivity. On the other hand, expansion of urban areas can also facilitate the spread of human commensals including pests. Knowledge of the features of cityscapes that facilitate gene flow and maintain diversity of pests is thus key to their management and eradication. References [1] Rivkin, L. R., Santangelo, J. S., Alberti, M. et al. (2019). A roadmap for urban evolutionary ecology. Evolutionary Applications, 12(3), 384-398. doi: 10.1111/eva.12734 | Interplay between historical and current features of the cityscape in shaping the genetic structure of the house mouse (Mus musculus domesticus) in Dakar (Senegal, West Africa) | Claire Stragier, Sylvain Piry, Anne Loiseau, Mamadou Kane, Aliou Sow, Youssoupha Niang, Mamoudou Diallo, Arame Ndiaye, Philippe Gauthier, Marion Borderon, Laurent Granjon, Carine Brouat, Karine Berthier | <p>Population genetic approaches may be used to investigate dispersal patterns of species living in highly urbanized environment in order to improve management strategies for biodiversity conservation or pest control. However, in such environment,... | | Biological invasions, Landscape ecology, Molecular ecology | Michelle DiLeo | 2019-02-22 08:36:13 | ||
15 Feb 2024
Sources of confusion in global biodiversity trendsUnraveling the Complexity of Global Biodiversity Dynamics: Insights and ImperativesRecommended by Paulo Borges based on reviews by Pedro Cardoso and 1 anonymous reviewer based on reviews by Pedro Cardoso and 1 anonymous reviewer
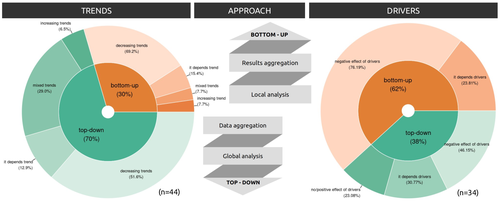
Biodiversity loss is occurring at an alarming rate across terrestrial and marine ecosystems, driven by various processes that degrade habitats and threaten species with extinction. Despite the urgency of this issue, empirical studies present a mixed picture, with some indicating declining trends while others show more complex patterns. In a recent effort to better understand global biodiversity dynamics, Boennec et al. (2024) conducted a comprehensive literature review examining temporal trends in biodiversity. Their analysis reveals that reviews and meta-analyses, coupled with the use of global indicators, tend to report declining trends more frequently. Additionally, the study underscores a critical gap in research: the scarcity of investigations into the combined impact of multiple pressures on biodiversity at a global scale. This lack of understanding complicates efforts to identify the root causes of biodiversity changes and develop effective conservation strategies. This study serves as a crucial reminder of the pressing need for long-term biodiversity monitoring and large-scale conservation studies. By filling these gaps in knowledge, researchers can provide policymakers and conservation practitioners with the insights necessary to mitigate biodiversity loss and safeguard ecosystems for future generations. References Boennec, M., Dakos, V. & Devictor, V. (2023). Sources of confusion in global biodiversity trend. bioRxiv, ver. 4 peer-reviewed and recommended by Peer Community in Ecology. https://doi.org/10.32942/X29W3H
| Sources of confusion in global biodiversity trends | Maelys Boennec, Vasilis Dakos, Vincent Devictor | <p>Populations and ecological communities are changing worldwide, and empirical studies exhibit a mixture of either declining or mixed trends. Confusion in global biodiversity trends thus remains while assessing such changes is of major social, po... | | Biodiversity, Conservation biology, Meta-analyses | Paulo Borges | 2023-09-20 11:10:25 | ||
03 Apr 2020
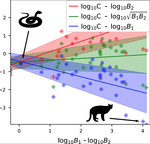
A macro-ecological approach to predators' functional responseA meta-analysis to infer generic predator functional responseRecommended by Samir Simon Suweis based on reviews by Ludek Berec and gyorgy barabasSpecies interactions are classically derived from the law of mass action: the probability that, for example, a predation event occurs is proportional to the product of the density of the prey and predator species. In order to describe how predator and prey species populations grow, is then necessary to introduce functional response, describing the intake rate of a consumer as a function of food (e.g. prey) density. References [1] Volterra, V. (1928). Variations and Fluctuations of the Number of Individuals in Animal Species living together. ICES Journal of Marine Science, 3(1), 3–51. doi: 10.1093/icesjms/3.1.3 | A macro-ecological approach to predators' functional response | Matthieu Barbier, Laurie Wojcik, Michel Loreau | <p>Predation often deviates from the law of mass action: many micro- and meso-scale experiments have shown that consumption saturates with resource abundance, and decreases due to interference between consumers. But does this observation hold at m... | | Community ecology, Food webs, Meta-analyses, Theoretical ecology | Samir Simon Suweis | 2019-11-08 15:42:16 | ||
05 Apr 2019

Using a large-scale biodiversity monitoring dataset to test the effectiveness of protected areas at conserving North-American breeding birdsProtected Areas effects on biodiversity: a test using bird data that hopefully will give ideas for much more studies to comeRecommended by Paul Caplat based on reviews by Willson Gaul and 1 anonymous reviewerIn the face of worldwide declines in biodiversity, evaluating the effectiveness of conservation practices is an absolute necessity. Protected Areas (PA) are a key tool for conservation, and the question “Are PA effective” has been on many a research agenda, as the introduction to this preprint will no doubt convince you. A challenge we face is that, until now, few studies have been explicitly designed to evaluate PA, and despite the rise of meta-analyses on the topic, our capacity to quantify their effect on biodiversity remains limited. References [1] Cazalis, V., Belghali, S., & Rodrigues, A. S. (2019). Using a large-scale biodiversity monitoring dataset to test the effectiveness of protected areas at conserving North-American breeding birds. bioRxiv, 433037, ver. 4 peer-reviewed and recommended by PCI Ecology. doi: 10.1101/433037 | Using a large-scale biodiversity monitoring dataset to test the effectiveness of protected areas at conserving North-American breeding birds | Victor Cazalis, Soumaya Belghali, Ana S.L. Rodrigues | <p>Protected areas currently cover about 15% of the global land area, and constitute one of the main tools in biodiversity conservation. Quantifying their effectiveness at protecting species from local decline or extinction involves comparing prot... | | Biodiversity, Conservation biology, Human impact, Landscape ecology, Macroecology | Paul Caplat | 2018-10-04 08:43:34 | ||
14 Dec 2018
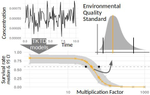
Recommendations to address uncertainties in environmental risk assessment using toxicokinetics-toxicodynamics modelsAddressing uncertainty in Environmental Risk Assessment using mechanistic toxicological models coupled with Bayesian inferenceRecommended by Luis Schiesari based on reviews by Andreas Focks and 2 anonymous reviewersEnvironmental Risk Assessment (ERA) is a strategic conceptual framework to characterize the nature and magnitude of risks, to humans and biodiversity, of the release of chemical contaminants in the environment. Several measures have been suggested to enhance the science and application of ERA, including the identification and acknowledgment of uncertainties that potentially influence the outcome of risk assessments, and the appropriate consideration of temporal scale and its linkage to assessment endpoints [1]. References [1] Dale, V. H., Biddinger, G. R., Newman, M. C., Oris, J. T., Suter, G. W., Thompson, T., ... & Chapman, P. M. (2008). Enhancing the ecological risk assessment process. Integrated environmental assessment and management, 4(3), 306-313. doi: 10.1897/IEAM_2007-066.1 | Recommendations to address uncertainties in environmental risk assessment using toxicokinetics-toxicodynamics models | Virgile Baudrot and Sandrine Charles | <p>Providing reliable environmental quality standards (EQS) is a challenging issue for environmental risk assessment (ERA). These EQS are derived from toxicity endpoints estimated from dose-response models to identify and characterize the environm... | | Chemical ecology, Ecotoxicology, Experimental ecology, Statistical ecology | Luis Schiesari | 2018-06-27 21:33:30 | ||
03 Jan 2024
Efficient sampling designs to assess biodiversity spatial autocorrelation : should we go fractal?Spatial patterns and autocorrelation challenges in ecological conservationRecommended by Eric Goberville based on reviews by Nigel Yoccoz and Charles J Marsh
“Pattern, like beauty, is to some extent in the eye of the beholder” (Grant 1977 in Wiens, 1989) Ecologists are immersed in unraveling the complex spatial patterns that govern species diversity, driven by both practical and theoretical imperatives (Rahbek, 2005; Wang et al., 2019). This dual focus necessitates a practical imperative for strategic biodiversity conservation, requiring a nuanced understanding of locations with peak species richness and dynamic shifts in species assemblages (Chase et al., 2020). Simultaneously, there is a theoretical interest in using diversity patterns as empirical testing grounds for theories explaining factors influencing diversity disparities and the associated increase in species turnover correlated with inter-site distance (Condit et al., 2002).
McGill (2010), in his paper "Matters of Scale", highlights the scale-dependent nature of ecology, aligning with the recognition that spatial autocorrelation is inherent in biogeographical data and often correlated with sample size (Rahbek, 2005). Spatial autocorrelation, often underestimated in ecological studies (Dormann, 2007), occurs when proximate locations exhibit similarities in ecological attributes (Tobler, 1970; Getis, 2010), introducing a latent bias that compromises the robustness of ecological findings (Dormann, 2007; Dormann et al., 2007). This phenomenon serves as both an asset, providing valuable information for inferring processes from patterns (Palma et al. 1999), and a challenge, imposing limitations on hypothesis testing and prediction (Dormann et al., 2007 and references therein). Various factors contribute to spatial autocorrelation, with three primary contributors (Dormann et al., 2007; Legendre, 1993; Legendre and Fortin, 1989; Legendre and Legendre, 2012): (i) distance-related effects in biological processes, (ii) misrepresentation of non-linear relationships between the environment and species as linear and (iii) the oversight of a crucial spatially structured environmental determinant in the statistical model, leading to spatial structuring in the response (Dormann et al., 2007).
Recognising the pivotal role of spatial heterogeneity in ecological theories (Wang et al., 2019), it becomes imperative to discern and address the limitations introduced by spatial autocorrelation (Legendre, 1993). McGill (2011) emphasises that the ultimate goal of biodiversity pattern studies should be to develop a quantitative predictive theory useful for conservation. The spatial dimension's importance in study planning, determining the system's scale, appropriate quadrat size, and spacing between sampling stations, is paramount (Fortin, 1999a,b). Responses to these considerations are intricately linked with study objectives and insights from pre-sampling campaigns, underscoring the need for a nuanced and rigorous approach (Delmelle, 2021).
Understanding statistical techniques and nested sampling designs is crucial to answering fundamental ecological questions (Dormann et al., 2007; McDonald, 2012). In addressing spatial autocorrelation challenges, ecologists must recognize the limitations of many standard statistical methods in ecological studies (Dale and Fortin, 2002; Legendre and Fortin, 1989; Steel et al., 2013). In the initial phases of description or hypothesis generation, ecologists should proactively acknowledge the spatial structure in their data and conduct tests for spatial autocorrelation (for a comprehensive description, see Legendre and Fortin, 1989): various tools, including correlograms, spectral analysis, the Mantel test, and clustering methods, facilitate the assessment and description of spatial structures. The partial Mantel test enables the study of causal models with space as an explanatory variable. Techniques for mapping ecological variables, such as interpolation, trend surface analysis, and constrained clustering, yield maps providing valuable insights into the spatial dynamics of ecological systems.
This refined consideration of spatial autocorrelation emerges as an imperative in ecological research, fostering a deeper and more precise understanding of the intricate interplay between species diversity, spatial patterns, and the inherent limitations imposed by spatial autocorrelation (Legendre et al., 2002). This not only contributes significantly to the scientific discourse in ecology but also aligns with McGill's vision of developing predictive theories for effective conservation (Bacaro et al., 2016; McGill, 2011).
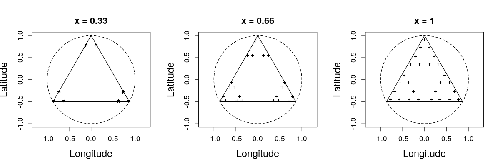
In this study by Fabien Laroche (2023), titled “Efficient sampling designs to assess biodiversity spatial autocorrelation: should we go fractal?” the primary focus was on addressing the challenges associated with estimating the autocorrelation range of species distribution across spatial scales. The study aimed to explore alternative sampling designs, with a particular focus on the application of fractal designs—self-similar designs with well-identified scales. The overarching goal was to evaluate whether fractal designs could offer a more efficient compromise compared to traditional hybrid designs, which involve mixing random sampling points with a systematic grid.
Virtual ecology provides a way to test whether sampling designs can accurately detect or quantify effects of interest before implementing them in the field. Beyond the question of assessing the power of empirical designs, a virtual ecology analysis contributes to clearly formulating the set of questions associated with a design. However, only a few virtual studies have focused on efficient designs to accurately estimate the autocorrelation range of biodiversity variables. In this study, the statistical framework of optimal design of experiments was employed—a methodology often used in building and comparing designs of temporal or spatiotemporal biodiversity surveys but rarely applied to the specific problem of quantifying spatial autocorrelation.
Key findings from the study shed light on optimal sampling strategies, with a notable dependence on the feasible grid mesh size over the study area in relation to expected autocorrelation range values. The results demonstrated that the efficiency of designs varied based on the specific effect under study. Fractal designs, however, exhibited superior performance, particularly when assessing the effect of a monotonic environmental gradient across space.
In conclusion, the study provides valuable insights into the potential benefits of incorporating fractal designs in biodiversity studies, offering a nuanced and efficient approach to estimate spatial autocorrelation. These findings contribute significantly to the ongoing scientific discourse in ecology, providing practical considerations for improving sampling designs in biodiversity assessments.
References
Bacaro, G., Altobelli, A., Cameletti, M., Ciccarelli, D., Martellos, S., Palmer, M.W., Ricotta, C., Rocchini, D., Scheiner, S.M., Tordoni, E., Chiarucci, A., 2016. Incorporating spatial autocorrelation in rarefaction methods: Implications for ecologists and conservation biologists. Ecological Indicators 69, 233-238. https://doi.org/10.1016/j.ecolind.2016.04.026
Chase, J.M., Jeliazkov, A., Ladouceur, E., Viana, D.S., 2020. Biodiversity conservation through the lens of metacommunity ecology. Annals of the New York Academy of Sciences 1469, 86-104. https://doi.org/10.1111/nyas.14378
Condit, R., Pitman, N., Leigh, E.G., Chave, J., Terborgh, J., Foster, R.B., Núñez, P., Aguilar, S., Valencia, R., Villa, G., Muller-Landau, H.C., Losos, E., Hubbell, S.P., 2002. Beta-Diversity in Tropical Forest Trees. Science 295, 666-669. https://doi.org/10.1126/science.1066854
Dale, M.R.T., Fortin, M.-J., 2002. Spatial autocorrelation and statistical tests in ecology. Écoscience 9, 162-167. https://doi.org/10.1080/11956860.2002.11682702
Delmelle, E.M., 2021. Spatial Sampling, in: Fischer, M.M., Nijkamp, P. (Eds.), Handbook of Regional Science. Springer Berlin Heidelberg, Berlin, Heidelberg, pp. 1829-1844.
Dormann, C.F., 2007. Effects of incorporating spatial autocorrelation into the analysis of species distribution data. Global Ecology & Biogeography 16, 129-128. https://doi.org/10.1111/j.1466-8238.2006.00279.x
Dormann, C.F., McPherson, J.M., Araújo, M.B., Bivand, R., Bolliger, J., Carl, G., Davies, R.G., Hirzel, A., Jetz, W., Kissling, W.D., Kühn, I., Ohlemüler, R., Peres-Neto, P.R., Reineking, B., Schröder, B., Schurr, F.M., Wilson, R., 2007. Methods to account for spatial autocorrelation in the analysis of species distributional data: a review. Ecography 33, 609-628. https://doi.org/10.1111/j.2007.0906-7590.05171.x
Fortin, M.-J., 1999a. Effects of quadrat size and data measurement on the detection of boundaries. Journal of Vegetation Science 10, 43-50. https://doi.org/10.2307/3237159
Fortin, M.-J., 1999b. Effects of sampling unit resolution on the estimation of spatial autocorrelation. Écoscience 6, 636-641. https://doi.org/10.1080/11956860.1999.11682547
Getis, A., 2010. Spatial Autocorrelation, in: Fischer, M.M., Getis, A. (Eds.), Handbook of Applied Spatial Analysis: Software Tools, Methods and Applications. Springer Berlin Heidelberg, Berlin, Heidelberg, pp. 255-278.
Laroche, F., 2023. Efficient sampling designs to assess biodiversity spatial autocorrelation: should we go fractal? bioRxiv, 2022.07.29.501974, ver. 4 peer-reviewed and recommended by Peer Community in Ecology. https://doi.org/10.1101/2022.07.29.501974
Legendre, P., 1993. Spatial Autocorrelation: Trouble or New Paradigm? Ecology 74, 1659-1673. https://doi.org/10.2307/1939924
Legendre, P., Dale, M.R.T., Fortin, M.-J., Gurevitch, J., Hohn, M., Myers, D., 2002. The consequences of spatial structure for the design and analysis of ecological field surveys. Ecography 25, 601-615. https://doi.org/10.1034/j.1600-0587.2002.250508.x
Legendre, P., Fortin, M.J., 1989. Spatial pattern and ecological analysis. Vegetatio 80, 107-138. https://doi.org/10.1007/BF00048036
Legendre, P., Legendre, L., 2012. Numerical Ecology, Third Edition ed. Elsevier, The Netherlands.
McDonald, T., 2012. Spatial sampling designs for long-term ecological monitoring, in: Cooper, A.B., Gitzen, R.A., Licht, D.S., Millspaugh, J.J. (Eds.), Design and Analysis of Long-term Ecological Monitoring Studies. Cambridge University Press, Cambridge, pp. 101-125.
McGill, B.J., 2010. Matters of Scale. Science 328, 575-576. https://doi.org/10.1126/science.1188528
McGill, B.J., 2011. Linking biodiversity patterns by autocorrelated random sampling. American Journal of Botany 98, 481-502. https://doi.org/10.3732/ajb.1000509
Rahbek, C., 2005. The role of spatial scale and the perception of large-scale species-richness patterns. Ecology Letters 8, 224-239. https://doi.org/10.1111/j.1461-0248.2004.00701.x
Steel, E.A., Kennedy, M.C., Cunningham, P.G., Stanovick, J.S., 2013. Applied statistics in ecology: common pitfalls and simple solutions. Ecosphere 4, art115. https://doi.org/10.1890/ES13-00160.1
Tobler, W.R., 1970. A Computer Movie Simulating Urban Growth in the Detroit Region. Economic Geography 46, 234-240. https://doi.org/10.2307/143141
Wang, S., Lamy, T., Hallett, L.M., Loreau, M., 2019. Stability and synchrony across ecological hierarchies in heterogeneous metacommunities: linking theory to data. Ecography 42, 1200-1211. https://doi.org/10.1111/ecog.04290
Wiens, J.A., 1989. The ecology of bird communities. Cambridge University Press.
| Efficient sampling designs to assess biodiversity spatial autocorrelation : should we go fractal? | Fabien Laroche | <p>Quantifying the autocorrelation range of species distribution in space is necessary for applied ecological questions, like implementing protected area networks or monitoring programs. However, the power of spatial sampling designs to estimate t... | | Biodiversity, Landscape ecology, Spatial ecology, Metacommunities & Metapopulations, Statistical ecology | Eric Goberville | 2023-04-21 10:54:29 | ||
31 Oct 2022
Ten simple rules for working with high resolution remote sensing dataPreventing misuse of high-resolution remote sensing dataRecommended by Eric Goberville based on reviews by Jane Wyngaard and 1 anonymous reviewer
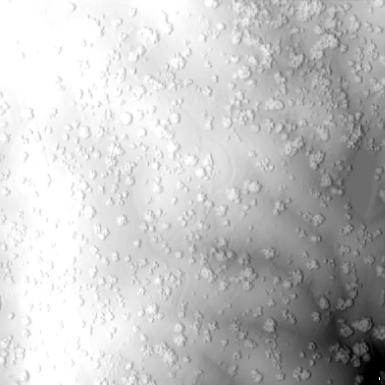
To observe, characterise, identify, understand, predict... This is the approach that researchers follow every day. This sequence is tirelessly repeated as the biological model, the targeted ecosystem and/or the experimental, environmental or modelling conditions change. This way of proceeding is essential in a world of rapid change in response to the frenetic pace of intensifying pressures and forcings that impact ecosystems. To better understand our Earth and the dynamics of its components, to map ecosystems and diversity patterns, and to identify changes, humanity had to demonstrate inventiveness and defy gravity. Gustave Hermite and Georges Besançon were the first to launch aloft balloons equipped with radio transmitters, making possible the transmission of meteorological data to observers in real time [1]. The development of aviation in the middle of the 20th century constituted a real leap forward for the frequent acquisition of aerial observations, leading to a significant improvement in weather forecasting models. The need for systematic collection of data as holistic as possible – an essential component for the observation of complex biological systems - has resulted in pushing the limits of technological prowess. The conquest of space and the concurrent development of satellite observations has largely contributed to the collection of a considerable mass of data, placing our Earth under the "macroscope" - a concept introduced to ecology in the early 1970s by Howard T. Odum (see [2]), and therefore allowing researchers to move towards a better understanding of ecological systems, deterministic and stochastic patterns … with the ultimate goal of improving management actions [2,3]. Satellite observations have been carried out for nearly five decades now [3] and have greatly contributed to a better qualitative and quantitative understanding of the functioning of our planet, its diversity, its climate... and to a better anticipation of possible future changes (e.g., [4-7]). This access to rich and complex sources of information, for which both spatial and temporal resolutions are increasingly fine, results in the implementation of increasingly complex computation-based analyses, in order to meet the need for a better understanding of ecological mechanisms and processes, and their possible changes. Steven Levitt stated that "Data is one of the most powerful mechanisms for telling stories". This is so true … Data should not be used as a guide to thinking and a critical judgment at each stage of the data exploitation process should not be neglected. This is what Mahood et al. [8] rightly remind us in their article "Ten simple rules for working with high-resolution remote sensing data" in which they provide the fundamentals to consider when working with data of this nature, a still underutilized resource in several topics, such as conservation biology [3]. In this unconventional article, presented in a pedagogical way, the authors remind different generations of readers how satellite data should be handled and processed. The authors aim to make the readers aware of the most frequent pitfalls encouraging them to use data adapted to their original question, the most suitable tools/methods/procedures, to avoid methodological overkill, and to ensure both ethical use of data and transparency in the research process. While access to high-resolution data is increasingly easy thanks to the implementation of dedicated platforms [4], and because of the development of easy-to-use processing software and pipelines, it is important to take the time to recall some of the essential rules and guidelines for managing them, from new users with little or no experience who will find in this article the recommendations, resources and advice necessary to start exploiting remote sensing data, to more experienced researchers. References [1] Jeannet P, Philipona R, and Richner H (2016). 8 Swiss upper-air balloon soundings since 1902. In: Willemse S, Furger M (2016) From weather observations to atmospheric and climate sciences in Switzerland: Celebrating 100 years of the Swiss Society for Meteorology. vdf Hochschulverlag AG. [2] Odum HT (2007) Environment, Power, and Society for the Twenty-First Century: The Hierarchy of Energy. Columbia University Press. [3] Boyle SA, Kennedy CM, Torres J, Colman K, Pérez-Estigarribia PE, Sancha NU de la (2014) High-Resolution Satellite Imagery Is an Important yet Underutilized Resource in Conservation Biology. PLOS ONE, 9, e86908. https://doi.org/10.1371/journal.pone.0086908 [4] Le Traon P-Y, Antoine D, Bentamy A, Bonekamp H, Breivik LA, Chapron B, Corlett G, Dibarboure G, DiGiacomo P, Donlon C, Faugère Y, Font J, Girard-Ardhuin F, Gohin F, Johannessen JA, Kamachi M, Lagerloef G, Lambin J, Larnicol G, Le Borgne P, Leuliette E, Lindstrom E, Martin MJ, Maturi E, Miller L, Mingsen L, Morrow R, Reul N, Rio MH, Roquet H, Santoleri R, Wilkin J (2015) Use of satellite observations for operational oceanography: recent achievements and future prospects. Journal of Operational Oceanography, 8, s12–s27. https://doi.org/10.1080/1755876X.2015.1022050 [5] Turner W, Rondinini C, Pettorelli N, Mora B, Leidner AK, Szantoi Z, Buchanan G, Dech S, Dwyer J, Herold M, Koh LP, Leimgruber P, Taubenboeck H, Wegmann M, Wikelski M, Woodcock C (2015) Free and open-access satellite data are key to biodiversity conservation. Biological Conservation, 182, 173–176. https://doi.org/10.1016/j.biocon.2014.11.048 [6] Melet A, Teatini P, Le Cozannet G, Jamet C, Conversi A, Benveniste J, Almar R (2020) Earth Observations for Monitoring Marine Coastal Hazards and Their Drivers. Surveys in Geophysics, 41, 1489–1534. https://doi.org/10.1007/s10712-020-09594-5 [7] Zhao Q, Yu L, Du Z, Peng D, Hao P, Zhang Y, Gong P (2022) An Overview of the Applications of Earth Observation Satellite Data: Impacts and Future Trends. Remote Sensing, 14, 1863. https://doi.org/10.3390/rs14081863 [8] Mahood AL, Joseph MB, Spiers A, Koontz MJ, Ilangakoon N, Solvik K, Quarderer N, McGlinchy J, Scholl V, Denis LS, Nagy C, Braswell A, Rossi MW, Herwehe L, Wasser L, Cattau ME, Iglesias V, Yao F, Leyk S, Balch J (2021) Ten simple rules for working with high resolution remote sensing data. OSFpreprints, ver. 6 peer-reviewed and recommended by Peer Community in Ecology. https://doi.org/10.31219/osf.io/kehqz | Ten simple rules for working with high resolution remote sensing data | Adam L. Mahood, Maxwell Benjamin Joseph, Anna Spiers, Michael J. Koontz, Nayani Ilangakoon, Kylen Solvik, Nathan Quarderer, Joe McGlinchy, Victoria Scholl, Lise St. Denis, Chelsea Nagy, Anna Braswell, Matthew W. Rossi, Lauren Herwehe, Leah wasser,... | <p>Researchers in Earth and environmental science can extract incredible value from high-resolution (sub-meter, sub-hourly or hyper-spectral) remote sensing data, but these data can be difficult to use. Correct, appropriate and competent use of su... | | Biogeography, Landscape ecology, Macroecology, Spatial ecology, Metacommunities & Metapopulations, Terrestrial ecology | Eric Goberville | 2021-10-19 21:41:22 | ||
21 Dec 2020

Influence of local landscape and time of year on bat-road collision risksAssessing bat-vehicle collision risks using acoustic 3D trackingRecommended by Gloriana Chaverri based on reviews by Mark Brigham and ?
The loss of biodiversity is an issue of great concern, especially if the extinction of species or the loss of a large number of individuals within populations results in a loss of critical ecosystem services. We know that the most important threat to most species is habitat loss and degradation (Keil et al., 2015; Pimm et al., 2014); the latter can be caused by multiple anthropogenic activities, including pollution, introduction of invasive species and fragmentation (Brook et al., 2008; Scanes, 2018). Roads are a major cause of habitat fragmentation, isolating previously connected populations and being a direct source of mortality for animals that attempt to cross them (Spellberg, 1998). References [1] Bartonička T, Andrášik R, Duľa M, Sedoník J, Bíl M (2018) Identification of local factors causing clustering of animal-vehicle collisions. The Journal of Wildlife Management, 82, 940–947. https://doi.org/10.1002/jwmg.21467 | Influence of local landscape and time of year on bat-road collision risks | Charlotte Roemer, Aurélie Coulon, Thierry Disca, and Yves Bas | <p>Roads impact bat populations through habitat loss and collisions. High quality habitats particularly increase bat mortalities on roads, yet many questions remain concerning how local landscape features may influence bat behaviour and lead to hi... | | Behaviour & Ethology, Biodiversity, Conservation biology, Human impact, Landscape ecology | Gloriana Chaverri | 2020-07-20 10:56:29 | ||
14 May 2019
Field assessment of precocious maturation in salmon parr using ultrasound imagingOB-GYN for salmon parrsRecommended by Jean-Olivier Irisson based on reviews by Hervé CAPRA and 1 anonymous reviewer
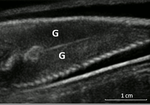
Population dynamics and stock assessment models are only as good as the data used to parameterise them. For Atlantic salmon (Salmo salar) populations, a critical parameter may be frequency of precocious maturation. Indeed, the young males (parrs) that mature early, before leaving the river to reach the ocean, can contribute to reproduction but have much lower survival rates afterwards. The authors cite evidence of the potentially major consequences of this alternate reproductive strategy. So, to be parameterised correctly, it needs to be assessed correctly. Cue the ultrasound machine. Through a thorough analysis of data collected on 850 individuals [1], over three years, the authors clearly show that the non-invasive examination of the internal cavity of young fishes to look for gonads, using a portable ultrasound machine, provides reliable and replicable evidence of precocious maturation. They turned into OB-GYN for salmons (albeit for male salmons!) and it worked. While using ultrasounds to detect fish gonads is not a new idea (early attempts for salmonids date back to the 80s [2]), the value here is in the comparison with the classic visual inspection technique (which turns out to be less reliable) and the fact that ultrasounds can now easily be carried out in the field. Beyond the potentially important consequences of this new technique for the correct assessment of salmon population dynamics, the authors also make the case for the acquisition of more reliable individual-level data in ecological studies, which I applaud. References. [1] Nevoux M, Marchand F, Forget G, Huteau D, Tremblay J, and Destouches J-P. (2019). Field assessment of precocious maturation in salmon parr using ultrasound imaging. bioRxiv 425561, ver. 3 peer-reviewed and recommended by PCI Ecology. doi: 10.1101/425561 | Field assessment of precocious maturation in salmon parr using ultrasound imaging | Marie Nevoux, Frédéric Marchand, Guillaume Forget, Dominique Huteau, Julien Tremblay, Jean-Pierre Destouches | <p>Salmonids are characterized by a large diversity of life histories, but their study is often limited by the imperfect observation of the true state of an individual in the wild. Challenged by the need to reduce uncertainty of empirical data, re... | | Conservation biology, Demography, Experimental ecology, Freshwater ecology, Life history, Phenotypic plasticity, Population ecology | Jean-Olivier Irisson | 2018-09-25 17:24:59 |


