
Direct submissions to PCI Ecology from bioRxiv.org are possible using the B2J service
Latest recommendations

| Id | Title * ▲ | Authors * | Abstract * | Picture * | Thematic fields * | Recommender | Reviewers | Submission date | |
|---|---|---|---|---|---|---|---|---|---|
02 Aug 2021

Dynamics of Fucus serratus thallus photosynthesis and community primary production during emersion across seasons: canopy dampening and biochemical acclimationTowards a better understanding of the effects of self-shading on Fucus serratus populationsRecommended by Cédric Hubas based on reviews by Gwenael Abril, Francesca Rossi and 1 anonymous reviewer based on reviews by Gwenael Abril, Francesca Rossi and 1 anonymous reviewer
The importance of the vertical structure of vegetation cover for the functioning, management and conservation of ecosystems has received particular attention from ecologists in the last decades. Canopy architecture has many implications for light extinction coefficient, temperature variation reduction, self-shading which are all key parameters for the structuring and functioning of different ecosystems such as grasslands [1,2], forests [3,4], phytoplankton communities [5, 6], macroalgal populations [7] and even underwater animal forests such as octocoral communities [8]. This research topic, therefore, benefits from a large body of literature and the facilitative role of self-shadowing is no longer in question. However, it is always puzzling to note that some of the most common ecosystems turn out to be amongst the least known. This is precisely the case of the Fucus serratus communities which are widespread in Northeast Atlantic along the Atlantic coast of Europe from Svalbard to Portugal, as well as Northwest Atlantic & Gulf of St. Lawrence, easily accessible at low tide, but which have comparatively received less attention than more emblematic macro-algal communities such as Laminariales. The lack of attention paid to these most common Fucales is particularly critical as some species such as F. serratus are proving to be particularly vulnerable to environmental change, leading to a predicted northward retreat from its current southern boundary [9]. In the present study [10], the authors showed the importance of the vegetation cover in resisting tide-induced environmental stresses. The canopy of F. serratus mitigates stress levels experienced in the lower layers during emersion, while various acclimation strategies take over to maintain the photosynthetic apparatus in optimal conditions. They hereby highlight adaptation mechanisms to the extreme environment represented by the intertidal zone. These adaptation strategies were expected and similar mechanisms had been shown at the cellular level previously [11]. The earliest studies on the subject have shown that the structure of the bottom, the movement of water, and light availability all "influence the distribution of Fucaceae and disturb the regularity of their fine zonation, which itself is caused by the most important factor, desiccation", as Zaneveld states in his review [12]. He observed that the causes of the zonal distribution of marine algae are numerous, and identified several points of interest such as the relative period of emersion, the rapidity of desiccation, the loss of water, and the thickness of the cell walls. The present study thus highlights the existence of facilitative mechanisms associated with F. serratus canopy and nicely confirms previous work with in situ observations. It also highlights the importance of the vegetative cover in combating desiccation and introduces the dampening effect as a facilitating mechanism. The effect of the vegetation cover can sometimes even be felt beyond its immediate area of influence. A recent study shows that ground-level ozone is significantly reduced by the combined effects of canopy shading and turbulence [4]. Below the canopy, the light intensity becomes sufficiently low which inhibits ozone formation due to the decrease in the rates of hydroxyl radical formation and the rates of conversion of nitrogen dioxide to nitrogen oxide by photolysis. In addition, reductions in light levels associated with foliage promote ozone-destroying reactions between plant-emitted species, such as nitric oxide and/or alkenes, and ozone itself. The reduction in diffusivity slows the upward transport of surface emitted species, partially decoupling the area under the canopy from the rest of the atmosphere. By analogy with the work of Makar et al [4], and in the light of the results provided by the authors of this study, one may wonder whether the canopy dampening of F. serratus communities (and other common fucoids widely distributed on our coasts) might not also influence atmospheric chemistry, both at the Earth's surface and in the atmospheric boundary layer. The lack of accumulation of reactive oxygen species under the canopy found by the authors is consistent with this hypothesis and suggests that the damping effect of F. serratus may well have much wider consequences than expected. References [1] Jurik TW, Kliebenstein H (2000) Canopy Architecture, Light Extinction and Self-Shading of a Prairie Grass, Andropogon Gerardii. The American Midland Naturalist, 144, 51–65. http://www.jstor.org/stable/3083010 [2] Mitchley J, Willems JH (1995) Vertical canopy structure of Dutch chalk grasslands in relation to their management. Vegetatio, 117, 17–27. https://doi.org/10.1007/BF00033256 [3] Kane VR, Gillespie AR, McGaughey R, Lutz JA, Ceder K, Franklin JF (2008) Interpretation and topographic compensation of conifer canopy self-shadowing. Remote Sensing of Environment, 112, 3820–3832. https://doi.org/10.1016/j.rse.2008.06.001 [4] Makar PA, Staebler RM, Akingunola A, Zhang J, McLinden C, Kharol SK, Pabla B, Cheung P, Zheng Q (2017) The effects of forest canopy shading and turbulence on boundary layer ozone. Nature Communications, 8, 15243. https://doi.org/10.1038/ncomms15243 [5] Shigesada N, Okubo A (1981) Analysis of the self-shading effect on algal vertical distribution in natural waters. Journal of Mathematical Biology, 12, 311–326. https://doi.org/10.1007/BF00276919 [6] Barros MP, Pedersén M, Colepicolo P, Snoeijs P (2003) Self-shading protects phytoplankton communities against H2O2-induced oxidative damage. Aquatic Microbial Ecology, 30, 275–282. https://doi.org/10.3354/ame030275 [7] Ørberg SB, Krause-Jensen D, Mouritsen KN, Olesen B, Marbà N, Larsen MH, Blicher ME, Sejr MK (2018) Canopy-Forming Macroalgae Facilitate Recolonization of Sub-Arctic Intertidal Fauna and Reduce Temperature Extremes. Frontiers in Marine Science, 5. https://doi.org/10.3389/fmars.2018.00332 [8] Nelson H, Bramanti L (2020) From Trees to Octocorals: The Role of Self-Thinning and Shading in Underwater Animal Forests. In: Perspectives on the Marine Animal Forests of the World (eds Rossi S, Bramanti L), pp. 401–417. Springer International Publishing, Cham. https://doi.org/10.1007/978-3-030-57054-5_12 [9] Jueterbock A, Kollias S, Smolina I, Fernandes JMO, Coyer JA, Olsen JL, Hoarau G (2014) Thermal stress resistance of the brown alga Fucus serratus along the North-Atlantic coast: Acclimatization potential to climate change. Marine Genomics, 13, 27–36. https://doi.org/10.1016/j.margen.2013.12.008 [10] Migné A, Duong G, Menu D, Davoult D, Gévaert F (2021) Dynamics of Fucus serratus thallus photosynthesis and community primary production during emersion across seasons: canopy dampening and biochemical acclimation. HAL, hal-03079617, ver. 4 peer-reviewed and recommended by Peer community in Ecology. https://hal.archives-ouvertes.fr/hal-03079617 [11] Lichtenberg M, Kühl M (2015) Pronounced gradients of light, photosynthesis and O2 consumption in the tissue of the brown alga Fucus serratus. New Phytologist, 207, 559–569. https://doi.org/10.1111/nph.13396 [12] Zaneveld JS (1937) The Littoral Zonation of Some Fucaceae in Relation to Desiccation. Journal of Ecology, 25, 431–468. https://doi.org/10.2307/2256204 | Dynamics of Fucus serratus thallus photosynthesis and community primary production during emersion across seasons: canopy dampening and biochemical acclimation | Aline Migné, Gwendoline Duong, Dominique Menu, Dominique Davoult & François Gévaert | <p style="text-align: justify;">The brown alga <em>Fucus serratus</em> forms dense stands on the sheltered low intertidal rocky shores of the Northeast Atlantic coast. In the southern English Channel, these stands have proved to be highly producti... | | Marine ecology | Cédric Hubas | 2021-01-05 16:24:02 | ||
20 Oct 2021

Eco-evolutionary dynamics further weakens mutualistic interaction and coexistence under population declineDoomed by your partner: when mutualistic interactions are like an evolutionary millstone around a species’ neckRecommended by Sylvain Billiard based on reviews by 2 anonymous reviewers
Mutualistic interactions are the weird uncles of population and community ecology. They are everywhere, from the microbes aiding digestion in animals’ guts to animal-pollination services in ecosystems; They increase productivity through facilitation; They fascinate us when small birds pick the teeth of a big-mouthed crocodile. Yet, mutualistic interactions are far less studied and understood than competition or predation. Possibly because we are naively convinced that there is no mystery here: isn’t it obvious that mutualistic interactions necessarily facilitate species coexistence? Since mutualistic species benefit from one another, if one species evolves, the other should just follow, isn’t that so? It is not as simple as that, for several reasons. First, because simple mutualistic Lotka-Volterra models showed that most of the time mutualistic systems should drift to infinity and be unstable (e.g. Goh 1979). This is not what happens in natural populations, so something is missing in simple models. At a larger scale, that of communities, this is even worse, since we are still far from understanding the link between the topology of mutualistic networks and the stability of a community. Second, interactions are context-dependent: mutualistic species exchange resources, and thus from the point of view of one species the interaction is either beneficial or not, depending on the net gain of energy (e.g. Holland and DeAngelis 2010). In other words, considering interactions as mutualistic per se is too caricatural. Third, since evolution is blind, the evolutionary response of a species to an environmental change can have any effect on its mutualistic partner, and not necessarily a neutral or positive effect. This latter reason is particularly highlighted by the paper by A. Weinbach et al. (2021). Weinbach et al. considered a simple two-species mutualistic Lotka-Volterra model and analyzed the evolutionary dynamics of a trait controlling for the rate of interaction between the two species by using the classical Adaptive Dynamics framework. They showed that, depending on the form of the trade-off between this interaction trait and its effect on the intrinsic growth rate, several situations can occur at evolutionary equilibrium: species can stably coexist and maintain their interaction, or the interaction traits can evolve to zero where species can coexist without any interactions. Weinbach et al. then investigated the fate of the two-species system if a partner species is strongly affected by environmental change, for instance, a large decrease of its growth rate. Because of the supposed trade-off between the interaction trait and the growth rate, the interaction trait in the focal species tends to decrease as an evolutionary response to the decline of the partner species. If environmental change is too large, the interaction trait can evolve to zero and can lead the partner species to extinction. An “evolutionary murder”. Even though Weinbach et al. interpreted the results of their model through the lens of plant-pollinators systems, their model is not specific to this case. On the contrary, it is very general, which has advantages and caveats. By its generality, the model is informative because it is a proof of concept that the evolution of mutualistic interactions can have unexpected effects on any category of mutualistic systems. Yet, since the model lacks many specificities of plant-pollinator interactions, it is hard to evaluate how their result would apply to plant-pollinators communities. I wanted to recommend this paper as a reminder that it is certainly worth studying the evolution of mutualistic interactions, because i) some unexpected phenomenons can occur, ii) we are certainly too naive about the evolution and ecology of mutualistic interactions, and iii) one can wonder to what extent we will be able to explain the stability of mutualistic communities without accounting for the co-evolutionary dynamics of mutualistic species. References Goh BS (1979) Stability in Models of Mutualism. The American Naturalist, 113, 261–275. http://www.jstor.org/stable/2460204. Holland JN, DeAngelis DL (2010) A consumer–resource approach to the density-dependent population dynamics of mutualism. Ecology, 91, 1286–1295. https://doi.org/10.1890/09-1163.1 Weinbach A, Loeuille N, Rohr RP (2021) Eco-evolutionary dynamics further weakens mutualistic interaction and coexistence under population decline. bioRxiv, 570580, ver. 5 peer-reviewed and recommended by Peer Community in Ecology. https://doi.org/10.1101/570580 | Eco-evolutionary dynamics further weakens mutualistic interaction and coexistence under population decline | Avril Weinbach, Nicolas Loeuille, Rudolf P. Rohr | <p style="text-align: justify;">With current environmental changes, evolution can rescue declining populations, but what happens to their interacting species? Mutualistic interactions can help species sustain each other when their environment wors... | | Coexistence, Eco-evolutionary dynamics, Evolutionary ecology, Interaction networks, Pollination, Theoretical ecology | Sylvain Billiard | 2019-09-05 11:29:45 | ||
01 Mar 2023
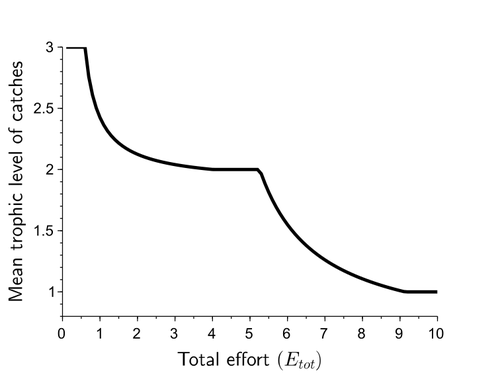
Effects of adaptive harvesting on fishing down processes and resilience changes in predator-prey and tritrophic systemsAdaptive harvesting, “fishing down the food web”, and regime shiftsRecommended by Amanda Lynn Caskenette based on reviews by Pierre-Yves HERNVANN and 1 anonymous reviewerThe mean trophic level of catches in world fisheries has generally declined over the 20th century, a phenomenon called "fishing down the food web" (Pauly et al. 1998). Several mechanisms have been proposed to explain this decline including the collapse of, or decline in, higher trophic level stocks leading to the inclusion of lower trophic level stocks in the fishery. Fishing down the food web may lead to a reduction in the resilience, i.e., the capacity to rebound from change, of the fished community, which is concerning given the necessity of resilience in the face of climate change. The practice of adaptive harvesting, which involves fishing stocks based on their availability, can also result in a reduction in the average trophic level of a fishery (Branch et al. 2010). Adaptive harvesting, similar to adaptive foraging, can affect the resilience of fisheries. Generally, adaptive foraging acts as a stabilizing force in communities (Valdovinos et al. 2010), however it is not clear how including harvesters as the adaptive foragers will affect the resilience of the system. Tromeur and Loeuille (2023) analyze the effects of adaptively harvesting a trophic community. Using a system of ordinary differential equations representing a predator-prey model where both species are harvested, the researchers mathematically analyze the impact of increasing fishing effort and adaptive harvesting on the mean trophic level and resilience of the fished community. This is achieved by computing the equilibrium densities and equilibrium allocation of harvest effort. In addition, the researchers numerically evaluate adaptive harvesting in a tri-trophic system (predator, prey, and resource). The study focuses on the effect of adaptively distributing harvest across trophic levels on the mean trophic level of catches, the propensity for regime shifts to occur, the ability to return to equilibrium after a disturbance, and the speed of this return. The results indicate that adaptive harvesting leads to a decline in the mean trophic level of catches, resulting in “fishing down the food web”. Furthermore, the study shows that adaptive harvesting may harm the overall resilience of the system. Similar results were observed numerically in a tri-trophic community. While adaptive foraging is generally a stabilizing force on communities, the researchers found that adaptive harvesting can destabilize the harvested community. One of the key differences between adaptive foraging models and the model presented here, is that the harvesters do not exhibit population dynamics. This lack of a numerical response by the harvesters to decreasing population sizes of their stocks leads to regime shifts. The realism of a fishery that does not respond numerically to declining stock is debatable, however it is very likely that there will a least be significant delays due to social and economic barriers to leaving the fishery, that will lead to similar results. This study is not unique in demonstrating the ability of adaptive harvesting to result in “fishing down the food web”. As pointed out by the researchers, the same results have been shown with several different model formulations (e.g., age and size structured models). Similarly, this study is not unique to showing that increasing adaptation speeds decreases the resilience of non-linear predator-prey systems by inducing oscillatory behaviours. Much of this can be explained by the destabilising effect of increasing interaction strengths on food webs (McCann et al. 1998). By employing a straightforward model, the researchers were able to demonstrate that adaptive harvesting, a common strategy employed by fishermen, can result in a decline in the average trophic level of catches, regime shifts, and reduced resilience in the fished community. While previous studies have observed some of these effects, the fact that the current study was able to capture them all with a simple model is notable. This modeling approach can offer insight into the role of human behavior on the complex dynamics observed in fisheries worldwide. References Branch, T. A., R. Watson, E. A. Fulton, S. Jennings, C. R. McGilliard, G. T. Pablico, D. Ricard, et al. 2010. The trophic fingerprint of marine fisheries. Nature 468:431–435. https://doi.org/10.1038/nature09528 Tromeur, E., and N. Loeuille. 2023. Effects of adaptive harvesting on fishing down processes and resilience changes in predator-prey and tritrophic systems. bioRxiv 290460, ver 5 peer-reviewed and recommended by PCI Ecology. https://doi.org/10.1101/290460 McCann, K., A. Hastings, and G.R. Huxel. 1998. Weak trophic interactions and the balance of nature. Nature 395: 794-798. https://doi.org/10.1038/27427 Pauly, D., V. Christensen, J. Dalsgaard, R. Froese, and F. Torres Jr. 1998. Fishing down marine food webs. Science 279:860–86. https://doi.org/10.1126/science.279.5352.860 Valdovinos, F.S., R. Ramos-Jiliberto, L. Garay-Naravez, P. Urbani, and J.A. Dunne. 2010. Consequences of adaptive behaviour for the structure and dynamics of food webs. Ecology Letters 13: 1546-1559. https://doi.org/10.1111/j.1461-0248.2010.01535.x | Effects of adaptive harvesting on fishing down processes and resilience changes in predator-prey and tritrophic systems | Eric Tromeur, Nicolas Loeuille | <p>Many world fisheries display a declining mean trophic level of catches. This "fishing down the food web" is often attributed to reduced densities of high-trophic-level species. We show here that the fishing down pattern can actually emerge from... | | Biodiversity, Community ecology, Food webs, Foraging, Population ecology, Theoretical ecology | Amanda Lynn Caskenette | 2022-05-03 21:09:35 | ||
06 May 2022

Effects of climate warming on the pine processionary moth at the southern edge of its range: a retrospective analysis on egg survival in TunisiaEven the current climate change winners could end up being losersRecommended by Elodie Vercken based on reviews by Matt Hill, Philippe Louapre, José Hodar and Corentin IltisClimate change is accelerating (IPCC 2022), and so applies ever stronger selective pressures on biodiversity (Segan et al. 2016). Possible responses include range shifts or adaptations to new climatic conditions (Bellard et al. 2012), but there is still much uncertainty about the extent of most species' adaptive capacities and the impact of extreme climatic events. Battisti A, Stastny M, Netherer S, Robinet C, Schopf A, Roques A, Larsson S (2005) Expansion of Geographic Range in the Pine Processionary Moth Caused by Increased Winter Temperatures. Ecological Applications, 15, 2084–2096. https://doi.org/10.1890/04-1903 Bellard C, Bertelsmeier C, Leadley P, Thuiller W, Courchamp F (2012) Impacts of climate change on the future of biodiversity. Ecology Letters, 15, 365–377. https://doi.org/10.1111/j.1461-0248.2011.01736.x Bourougaaoui A, Ben Jamâa ML, Robinet C (2021) Has North Africa turned too warm for a Mediterranean forest pest because of climate change? Climatic Change, 165, 46. https://doi.org/10.1007/s10584-021-03077-1 Bourougaaoui A, Robinet C, Jamaa MLB, Laparie M (2022) Effects of climate warming on the pine processionary moth at the southern edge of its range: a retrospective analysis on egg survival in Tunisia. bioRxiv, 2021.08.17.456665, ver. 5 peer-reviewed and recommended by Peer Community in Ecology. https://doi.org/10.1101/2021.08.17.456665 IPCC. 2022. Climate Change 2022: Impacts, Adaptation, and Vulnerability. Contribution of Working Group II to the Sixth Assessment Report of the Intergovernmental Panel on Climate Change [H.-O. Pörtner, D.C. Roberts, M. Tignor, E.S. Poloczanska, K. Mintenbeck, A. Alegría, M. Craig, S. Langsdorf, S. Löschke, V. Möller, A. Okem, B. Rama (eds.)]. Cambridge University Press. In Press. Segan DB, Murray KA, Watson JEM (2016) A global assessment of current and future biodiversity vulnerability to habitat loss–climate change interactions. Global Ecology and Conservation, 5, 12–21. https://doi.org/10.1016/j.gecco.2015.11.002 Verner D (2013) Tunisia in a Changing Climate : Assessment and Actions for Increased Resilience and Development. World Bank, Washington, DC. https://doi.org/10.1596/978-0-8213-9857-9 | Effects of climate warming on the pine processionary moth at the southern edge of its range: a retrospective analysis on egg survival in Tunisia | Asma Bourougaaoui, Christelle Robinet, Mohamed Lahbib Ben Jamâa, Mathieu Laparie | <p style="text-align: justify;">In recent years, ectotherm species have largely been impacted by extreme climate events, essentially heatwaves. In Tunisia, the pine processionary moth (PPM), <em>Thaumetopoea pityocampa</em>, is a highly damaging p... | | Climate change, Dispersal & Migration, Life history, Phenotypic plasticity, Species distributions, Terrestrial ecology, Thermal ecology, Zoology | Elodie Vercken | 2021-08-19 11:03:13 | ||
24 May 2024
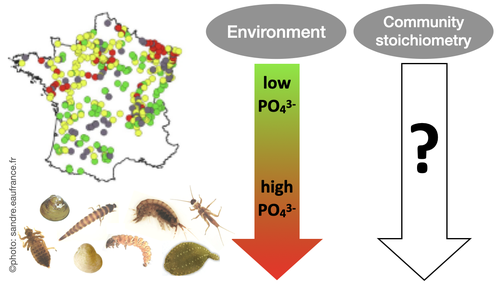
Effects of water nutrient concentrations on stream macroinvertebrate community stoichiometry: a large-scale studyThe influence of water phosphorus and nitrogen loads on stream macroinvertebrate community stoichiometryRecommended by Huihuang Chen based on reviews by Thomas Guillemaud, Jun Zuo and 1 anonymous reviewer
The manuscript by Beck et al. (2024) investigates the effects of water phosphorus and nitrogen loads on stream macroinvertebrate community stoichiometry across France. Utilizing data from over 1300 standardized sampling events, this research finds that community stoichiometry is significantly influenced by water phosphorus concentration, with the strongest effects at low nitrogen levels. The results demonstrate that the assumptions of Ecological Stoichiometry Theory apply at the community level for at least two dominant taxa and across a broad spatial scale, with probable implications for nutrient cycling and ecosystem functionality. This manuscript contributes to ecological theory, particularly by extending Ecological Stoichiometry Theory to include community-level interactions, clarifying the impact of nutrient concentrations on community structure and function, and informing nutrient management and conservation strategies. In summary, this study not only addresses a gap in community-level stoichiometric research but also delivers crucial empirical support for advancing ecological science and promoting environmental stewardship. References Beck M, Billoir E, Usseglio-Polatera P, Meyer A, Gautreau E and Danger M (2024) Effects of water nutrient concentrations on stream macroinvertebrate community stoichiometry: a large-scale study. bioRxiv, 2024.02.01.574823, ver. 2 peer-reviewed and recommended by Peer Community in Ecology. https://doi.org/10.1101/2024.02.01.574823 | Effects of water nutrient concentrations on stream macroinvertebrate community stoichiometry: a large-scale study | Miriam Beck, Elise Billoir, Philippe Usseglio-Polatera, Albin Meyer, Edwige Gautreau, Michael Danger | <p>Basal resources generally mirror environmental nutrient concentrations in the elemental composition of their tissue, meaning that nutrient alterations can directly reach consumer level. An increased nutrient content (e.g. phosphorus) in primary... | | Community ecology, Ecological stoichiometry | Huihuang Chen | Thomas Guillemaud, Jun Zuo, Anonymous | 2024-02-02 10:14:01 | |
03 Jan 2024
Efficient sampling designs to assess biodiversity spatial autocorrelation : should we go fractal?Spatial patterns and autocorrelation challenges in ecological conservationRecommended by Eric Goberville based on reviews by Nigel Yoccoz and Charles J Marsh
“Pattern, like beauty, is to some extent in the eye of the beholder” (Grant 1977 in Wiens, 1989) Ecologists are immersed in unraveling the complex spatial patterns that govern species diversity, driven by both practical and theoretical imperatives (Rahbek, 2005; Wang et al., 2019). This dual focus necessitates a practical imperative for strategic biodiversity conservation, requiring a nuanced understanding of locations with peak species richness and dynamic shifts in species assemblages (Chase et al., 2020). Simultaneously, there is a theoretical interest in using diversity patterns as empirical testing grounds for theories explaining factors influencing diversity disparities and the associated increase in species turnover correlated with inter-site distance (Condit et al., 2002).
McGill (2010), in his paper "Matters of Scale", highlights the scale-dependent nature of ecology, aligning with the recognition that spatial autocorrelation is inherent in biogeographical data and often correlated with sample size (Rahbek, 2005). Spatial autocorrelation, often underestimated in ecological studies (Dormann, 2007), occurs when proximate locations exhibit similarities in ecological attributes (Tobler, 1970; Getis, 2010), introducing a latent bias that compromises the robustness of ecological findings (Dormann, 2007; Dormann et al., 2007). This phenomenon serves as both an asset, providing valuable information for inferring processes from patterns (Palma et al. 1999), and a challenge, imposing limitations on hypothesis testing and prediction (Dormann et al., 2007 and references therein). Various factors contribute to spatial autocorrelation, with three primary contributors (Dormann et al., 2007; Legendre, 1993; Legendre and Fortin, 1989; Legendre and Legendre, 2012): (i) distance-related effects in biological processes, (ii) misrepresentation of non-linear relationships between the environment and species as linear and (iii) the oversight of a crucial spatially structured environmental determinant in the statistical model, leading to spatial structuring in the response (Dormann et al., 2007).
Recognising the pivotal role of spatial heterogeneity in ecological theories (Wang et al., 2019), it becomes imperative to discern and address the limitations introduced by spatial autocorrelation (Legendre, 1993). McGill (2011) emphasises that the ultimate goal of biodiversity pattern studies should be to develop a quantitative predictive theory useful for conservation. The spatial dimension's importance in study planning, determining the system's scale, appropriate quadrat size, and spacing between sampling stations, is paramount (Fortin, 1999a,b). Responses to these considerations are intricately linked with study objectives and insights from pre-sampling campaigns, underscoring the need for a nuanced and rigorous approach (Delmelle, 2021).
Understanding statistical techniques and nested sampling designs is crucial to answering fundamental ecological questions (Dormann et al., 2007; McDonald, 2012). In addressing spatial autocorrelation challenges, ecologists must recognize the limitations of many standard statistical methods in ecological studies (Dale and Fortin, 2002; Legendre and Fortin, 1989; Steel et al., 2013). In the initial phases of description or hypothesis generation, ecologists should proactively acknowledge the spatial structure in their data and conduct tests for spatial autocorrelation (for a comprehensive description, see Legendre and Fortin, 1989): various tools, including correlograms, spectral analysis, the Mantel test, and clustering methods, facilitate the assessment and description of spatial structures. The partial Mantel test enables the study of causal models with space as an explanatory variable. Techniques for mapping ecological variables, such as interpolation, trend surface analysis, and constrained clustering, yield maps providing valuable insights into the spatial dynamics of ecological systems.
This refined consideration of spatial autocorrelation emerges as an imperative in ecological research, fostering a deeper and more precise understanding of the intricate interplay between species diversity, spatial patterns, and the inherent limitations imposed by spatial autocorrelation (Legendre et al., 2002). This not only contributes significantly to the scientific discourse in ecology but also aligns with McGill's vision of developing predictive theories for effective conservation (Bacaro et al., 2016; McGill, 2011).
In this study by Fabien Laroche (2023), titled “Efficient sampling designs to assess biodiversity spatial autocorrelation: should we go fractal?” the primary focus was on addressing the challenges associated with estimating the autocorrelation range of species distribution across spatial scales. The study aimed to explore alternative sampling designs, with a particular focus on the application of fractal designs—self-similar designs with well-identified scales. The overarching goal was to evaluate whether fractal designs could offer a more efficient compromise compared to traditional hybrid designs, which involve mixing random sampling points with a systematic grid.
Virtual ecology provides a way to test whether sampling designs can accurately detect or quantify effects of interest before implementing them in the field. Beyond the question of assessing the power of empirical designs, a virtual ecology analysis contributes to clearly formulating the set of questions associated with a design. However, only a few virtual studies have focused on efficient designs to accurately estimate the autocorrelation range of biodiversity variables. In this study, the statistical framework of optimal design of experiments was employed—a methodology often used in building and comparing designs of temporal or spatiotemporal biodiversity surveys but rarely applied to the specific problem of quantifying spatial autocorrelation.
Key findings from the study shed light on optimal sampling strategies, with a notable dependence on the feasible grid mesh size over the study area in relation to expected autocorrelation range values. The results demonstrated that the efficiency of designs varied based on the specific effect under study. Fractal designs, however, exhibited superior performance, particularly when assessing the effect of a monotonic environmental gradient across space.
In conclusion, the study provides valuable insights into the potential benefits of incorporating fractal designs in biodiversity studies, offering a nuanced and efficient approach to estimate spatial autocorrelation. These findings contribute significantly to the ongoing scientific discourse in ecology, providing practical considerations for improving sampling designs in biodiversity assessments.
References
Bacaro, G., Altobelli, A., Cameletti, M., Ciccarelli, D., Martellos, S., Palmer, M.W., Ricotta, C., Rocchini, D., Scheiner, S.M., Tordoni, E., Chiarucci, A., 2016. Incorporating spatial autocorrelation in rarefaction methods: Implications for ecologists and conservation biologists. Ecological Indicators 69, 233-238. https://doi.org/10.1016/j.ecolind.2016.04.026
Chase, J.M., Jeliazkov, A., Ladouceur, E., Viana, D.S., 2020. Biodiversity conservation through the lens of metacommunity ecology. Annals of the New York Academy of Sciences 1469, 86-104. https://doi.org/10.1111/nyas.14378
Condit, R., Pitman, N., Leigh, E.G., Chave, J., Terborgh, J., Foster, R.B., Núñez, P., Aguilar, S., Valencia, R., Villa, G., Muller-Landau, H.C., Losos, E., Hubbell, S.P., 2002. Beta-Diversity in Tropical Forest Trees. Science 295, 666-669. https://doi.org/10.1126/science.1066854
Dale, M.R.T., Fortin, M.-J., 2002. Spatial autocorrelation and statistical tests in ecology. Écoscience 9, 162-167. https://doi.org/10.1080/11956860.2002.11682702
Delmelle, E.M., 2021. Spatial Sampling, in: Fischer, M.M., Nijkamp, P. (Eds.), Handbook of Regional Science. Springer Berlin Heidelberg, Berlin, Heidelberg, pp. 1829-1844.
Dormann, C.F., 2007. Effects of incorporating spatial autocorrelation into the analysis of species distribution data. Global Ecology & Biogeography 16, 129-128. https://doi.org/10.1111/j.1466-8238.2006.00279.x
Dormann, C.F., McPherson, J.M., Araújo, M.B., Bivand, R., Bolliger, J., Carl, G., Davies, R.G., Hirzel, A., Jetz, W., Kissling, W.D., Kühn, I., Ohlemüler, R., Peres-Neto, P.R., Reineking, B., Schröder, B., Schurr, F.M., Wilson, R., 2007. Methods to account for spatial autocorrelation in the analysis of species distributional data: a review. Ecography 33, 609-628. https://doi.org/10.1111/j.2007.0906-7590.05171.x
Fortin, M.-J., 1999a. Effects of quadrat size and data measurement on the detection of boundaries. Journal of Vegetation Science 10, 43-50. https://doi.org/10.2307/3237159
Fortin, M.-J., 1999b. Effects of sampling unit resolution on the estimation of spatial autocorrelation. Écoscience 6, 636-641. https://doi.org/10.1080/11956860.1999.11682547
Getis, A., 2010. Spatial Autocorrelation, in: Fischer, M.M., Getis, A. (Eds.), Handbook of Applied Spatial Analysis: Software Tools, Methods and Applications. Springer Berlin Heidelberg, Berlin, Heidelberg, pp. 255-278.
Laroche, F., 2023. Efficient sampling designs to assess biodiversity spatial autocorrelation: should we go fractal? bioRxiv, 2022.07.29.501974, ver. 4 peer-reviewed and recommended by Peer Community in Ecology. https://doi.org/10.1101/2022.07.29.501974
Legendre, P., 1993. Spatial Autocorrelation: Trouble or New Paradigm? Ecology 74, 1659-1673. https://doi.org/10.2307/1939924
Legendre, P., Dale, M.R.T., Fortin, M.-J., Gurevitch, J., Hohn, M., Myers, D., 2002. The consequences of spatial structure for the design and analysis of ecological field surveys. Ecography 25, 601-615. https://doi.org/10.1034/j.1600-0587.2002.250508.x
Legendre, P., Fortin, M.J., 1989. Spatial pattern and ecological analysis. Vegetatio 80, 107-138. https://doi.org/10.1007/BF00048036
Legendre, P., Legendre, L., 2012. Numerical Ecology, Third Edition ed. Elsevier, The Netherlands.
McDonald, T., 2012. Spatial sampling designs for long-term ecological monitoring, in: Cooper, A.B., Gitzen, R.A., Licht, D.S., Millspaugh, J.J. (Eds.), Design and Analysis of Long-term Ecological Monitoring Studies. Cambridge University Press, Cambridge, pp. 101-125.
McGill, B.J., 2010. Matters of Scale. Science 328, 575-576. https://doi.org/10.1126/science.1188528
McGill, B.J., 2011. Linking biodiversity patterns by autocorrelated random sampling. American Journal of Botany 98, 481-502. https://doi.org/10.3732/ajb.1000509
Rahbek, C., 2005. The role of spatial scale and the perception of large-scale species-richness patterns. Ecology Letters 8, 224-239. https://doi.org/10.1111/j.1461-0248.2004.00701.x
Steel, E.A., Kennedy, M.C., Cunningham, P.G., Stanovick, J.S., 2013. Applied statistics in ecology: common pitfalls and simple solutions. Ecosphere 4, art115. https://doi.org/10.1890/ES13-00160.1
Tobler, W.R., 1970. A Computer Movie Simulating Urban Growth in the Detroit Region. Economic Geography 46, 234-240. https://doi.org/10.2307/143141
Wang, S., Lamy, T., Hallett, L.M., Loreau, M., 2019. Stability and synchrony across ecological hierarchies in heterogeneous metacommunities: linking theory to data. Ecography 42, 1200-1211. https://doi.org/10.1111/ecog.04290
Wiens, J.A., 1989. The ecology of bird communities. Cambridge University Press.
| Efficient sampling designs to assess biodiversity spatial autocorrelation : should we go fractal? | Fabien Laroche | <p>Quantifying the autocorrelation range of species distribution in space is necessary for applied ecological questions, like implementing protected area networks or monitoring programs. However, the power of spatial sampling designs to estimate t... | | Biodiversity, Landscape ecology, Spatial ecology, Metacommunities & Metapopulations, Statistical ecology | Eric Goberville | 2023-04-21 10:54:29 | ||
12 Jun 2019

Environmental heterogeneity drives tsetse fly population dynamics and controlModeling jointly landscape complexity and environmental heterogeneity to envision new strategies for tsetse flies controlRecommended by Benjamin Roche based on reviews by Timothée Vergne and 1 anonymous reviewerToday, understanding spatio-temporal dynamics of pathogens is pivotal to understand their transmission and controlling them. First, understanding this dynamics can reveal the ecology of their transmission [1]. Indeed, such knowledge, based on data that are quite easy to access, can shed light on transmission modes, which could rely on different animal species that can be spatially distributed in a non-uniform way [2]. This is especially true for pathogens with complex life-cycles, despite that investigating such dynamics is very challenging and rely mostly on mathematical models. References [1] Grenfell, B. T., Bjørnstad, O. N., & Kappey, J. (2001). Travelling waves and spatial hierarchies in measles epidemics. Nature, 414(6865), 716-723. doi: 10.1038/414716a | Environmental heterogeneity drives tsetse fly population dynamics and control | Cecilia H, Arnoux S, Picault S, Dicko A, Seck MT, Sall B, Bassene M, Vreysen M, Pagabeleguem S, Bance A, Bouyer J, Ezanno P | <p>A spatially and temporally heterogeneous environment may lead to unexpected population dynamics. Knowledge still is needed on which of the local environment properties favour population maintenance at larger scale. For pathogen vectors, such as... | | Biological control, Population ecology, Spatial ecology, Metacommunities & Metapopulations | Benjamin Roche | 2018-12-14 12:13:39 | ||
16 Jun 2020
Environmental perturbations and transitions between ecological and evolutionary equilibria: an eco-evolutionary feedback frameworkStasis and the phenotypic gambitRecommended by Tom Van Dooren based on reviews by Jacob Johansson, Katja Räsänen and 1 anonymous reviewerThe preprint "Environmental perturbations and transitions between ecological and evolutionary equilibria: an eco-evolutionary feedback framework" by Coulson (2020) presents a general framework for evolutionary ecology, useful to interpret patterns of selection and evolutionary responses to environmental transitions. The paper is written in an accessible and intuitive manner. It reviews important concepts which are at the heart of evolutionary ecology. Together, they serve as a worldview which you can carry with you to interpret patterns in data or observations in nature. I very much appreciate it that Coulson (2020) presents his personal intuition laid bare, the framework he uses for his research and how several strong concepts from theoretical ecology fit in there. Overviews as presented in this paper are important to understand how we as researchers put the pieces together. References [1] Coulson, T. (2020) Environmental perturbations and transitions between ecological and evolutionary equilibria: an eco-evolutionary feedback framework. bioRxiv, 509067, ver. 4 peer-reviewed and recommended by PCI Ecology. doi: 10.1101/509067 | Environmental perturbations and transitions between ecological and evolutionary equilibria: an eco-evolutionary feedback framework | Tim Coulson | <p>I provide a general framework for linking ecology and evolution. I start from the fact that individuals require energy, trace molecules, water, and mates to survive and reproduce, and that phenotypic resource accrual traits determine an individ... | | Eco-evolutionary dynamics, Evolutionary ecology | Tom Van Dooren | 2019-01-03 10:05:16 | ||
30 Mar 2020
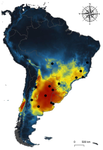
Environmental variables determining the distribution of an avian parasite: the case of the Philornis torquans complex (Diptera: Muscidae) in South AmericaCatching the fly in dystopian timesRecommended by Rodrigo Medel based on reviews by 4 anonymous reviewersHost-parasite interactions are ubiquitous on Earth. They are present in almost every conceivable ecosystem and often result from a long history of antagonist coevolution [1,2]. Recent studies on climate change have revealed, however, that modification of abiotic variables are often accompanied by shifts in the distributional range of parasites to habitats far beyond their original geographical distribution, creating new interactions in novel habitats with unpredictable consequences for host community structure and organization [3,4]. This situation may be especially critical for endangered host species having small population abundance and restricted distribution range. The infestation of bird species with larvae of the muscid fly genus Philornis is a case in point. At least 250 bird species inhabiting mostly Central and South America are infected by Philornis flies [5,6]. Fly larval development occurs in bird faeces, nesting material, or inside nestlings, affecting the development and nestling survival. References [1] Thompson JN (1994) The Coevolutionary Process. University of Chicago Press. | Environmental variables determining the distribution of an avian parasite: the case of the Philornis torquans complex (Diptera: Muscidae) in South America | Pablo F. Cuervo, Alejandro Percara, Lucas Monje, Pablo M. Beldomenico, Martín A. Quiroga | <p>*Philornis* flies are the major cause of myasis in altricial nestlings of neotropical birds. Its impact ranges from subtle to lethal, being of major concern in endangered bird species with geographically-restricted, fragmented and small-sized p... | | Biogeography, Macroecology, Parasitology, Species distributions | Rodrigo Medel | 2019-11-26 21:31:33 | ||
14 Nov 2022
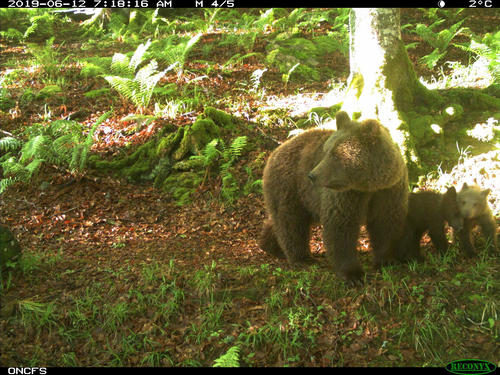
Estimating abundance of a recovering transboundary brown bear population with capture-recapture modelsA new and efficient approach to estimate, from protocol and opportunistic data, the size and trends of populations: the case of the Pyrenean brown bearRecommended by Nicolas BECH based on reviews by Tim Coulson, Romain Pigeault and ?In this study, the authors report a new method for estimating the abundance of the Pyrenean brown bear population. Precisely, the methodology involved aims to apply Pollock's closed robust design (PCRD) capture-recapture models to estimate population abundance and trends over time. Overall, the results encourage the use of PCRD to study populations' demographic rates, while minimizing biases due to inter-individual heterogeneity in detection probabilities. Estimating the size and trends of animal population over time is essential for informing conservation status and management decision-making (Nichols & Williams 2006). This is particularly the case when the population is small, geographically scattered, and threatened. Although several methods can be used to estimate population abundance, they may be difficult to implement when individuals are rare, elusive, solitary, largely nocturnal, highly mobile, and/or occupy large home ranges in remote and/or rugged habitats. Moreover, in such standard methods,
However, these conditions are rarely met in real populations, such as wild mammals (e.g., Bellemain et al. 2005; Solbert et al. 2006), and therefore the risk of underestimating population size can rapidly increase because the assumption of perfect detection of all individuals in the population is violated. Focusing on the critically endangered Pyrenean brown bear that was close to extinction in the mid-1990s, the study by Vanpe et al. (2022), uses protocol and opportunistic data to describe a statistical modeling exercise to construct mark-recapture histories from 2008 to 2020. Among the data, the authors collected non-invasive samples such as a mixture of hair and scat samples used for genetic identification, as well as photographic trap data of recognized individuals. These data are then analyzed in RMark to provide detection and survival estimates. The final model (i.e. PCRD capture-recapture) is then used to provide Bayesian population estimates. Results show a five-fold increase in population size between 2008 and 2020, from 13 to 66 individuals. Thus, this study represents the first published annual abundance and temporal trend estimates of the Pyrenean brown bear population since 2008. Then, although the results emphasize that the PCRD estimates were broadly close to the MRS counts and had reasonably narrow associated 95% Credibility Intervals, they also highlight that the sampling effort is different according to individuals. Indeed, as expected, the detection of an individual depends on
Overall, the PCRD capture-recapture modelling approach, involved in this study, provides robust estimates of abundance and demographic rates of the Pyrenean brown bear population (with associated uncertainty) while minimizing and considering bias due to inter-individual heterogeneity in detection probabilities. The authors conclude that mark-recapture provides useful population estimates and urge wildlife ecologists and managers to use robust approaches, such as the RDPC capture-recapture model, when studying large mammal populations. This information is essential to inform management decisions and assess the conservation status of populations.
References Bellemain, E.V.A., Swenson, J.E., Tallmon, D., Brunberg, S. and Taberlet, P. (2005). Estimating population size of elusive animals with DNA from hunter-collected feces: four methods for brown bears. Cons. Biol. 19(1), 150-161. https://doi.org/10.1111/j.1523-1739.2005.00549.x Nichols, J.D. and Williams, B.K. (2006). Monitoring for conservation. Trends Ecol. Evol. 21(12), 668-673. https://doi.org/10.1016/j.tree.2006.08.007 Otis, D.L., Burnham, K.P., White, G.C. and Anderson, D.R. (1978). Statistical inference from capture data on closed animal populations. Wildlife Monographs (62), 3-135. Solberg, K.H., Bellemain, E., Drageset, O.M., Taberlet, P. and Swenson, J.E. (2006). An evaluation of field and non-invasive genetic methods to estimate brown bear (Ursus arctos) population size. Biol. Conserv. 128(2), 158-168. https://doi.org/10.1016/j.biocon.2005.09.025 Vanpé C, Piédallu B, Quenette P-Y, Sentilles J, Queney G, Palazón S, Jordana IA, Jato R, Elósegui Irurtia MM, de la Torre JS, and Gimenez O (2022) Estimating abundance of a recovering transboundary brown bear population with capture-recapture models. bioRxiv, 2021.12.08.471719, ver. 4 recommended and peer-reviewed by PCI Ecology. https://doi.org/10.1101/2021.12.08.471719 | Estimating abundance of a recovering transboundary brown bear population with capture-recapture models | Cécile Vanpé, Blaise Piédallu, Pierre-Yves Quenette, Jérôme Sentilles, Guillaume Queney, Santiago Palazón, Ivan Afonso Jordana, Ramón Jato, Miguel Mari Elósegui Irurtia, Jordi Solà de la Torre, Olivier Gimenez | <p>Estimating the size of small populations of large mammals can be achieved via censuses, or complete counts, of recognizable individuals detected over a time period: minimum detected (population) size (MDS). However, as a population grows larger... | | Conservation biology, Demography, Population ecology | Nicolas BECH | 2022-01-20 10:49:59 |


