
Direct submissions to PCI Ecology from bioRxiv.org are possible using the B2J service
Latest recommendations

| Id | Title * | Authors * | Abstract * | Picture * | Thematic fields * | Recommender▲ | Reviewers | Submission date | |
|---|---|---|---|---|---|---|---|---|---|
16 Nov 2020
Intraspecific diversity loss in a predator species alters prey community structure and ecosystem functionsHidden diversity: how genetic richness affects species diversity and ecosystem processes in freshwater pondsRecommended by Frederik De Laender based on reviews by Andrew Barnes and Jes HinesBiodiversity loss can have important consequences for ecosystem functions, as exemplified by a large body of literature spanning at least three decades [1–3]. While connections between species diversity and ecosystem functions are now well-defined and understood, the importance of diversity within species is more elusive. Despite a surge in theoretical work on how intraspecific diversity can affect coexistence in simple community types [4,5], not much is known about how intraspecific diversity drives ecosystem processes in more complex community types. One particular challenge is that intraspecific diversity can be expressed as observable variation of functional traits, or instead subsist as genetic variation of which the consequences for ecosystem processes are harder to grasp. References [1] Tilman D, Downing JA (1994) Biodiversity and stability in grasslands. Nature, 367, 363–365. https://doi.org/10.1038/367363a0 | Intraspecific diversity loss in a predator species alters prey community structure and ecosystem functions | Allan Raffard, Julien Cucherousset, José M. Montoya, Murielle Richard, Samson Acoca-Pidolle, Camille Poésy, Alexandre Garreau, Frédéric Santoul & Simon Blanchet. | <p>Loss in intraspecific diversity can alter ecosystem functions, but the underlying mechanisms are still elusive, and intraspecific biodiversity-ecosystem function relationships (iBEF) have been restrained to primary producers. Here, we manipulat... | | Community ecology, Ecosystem functioning, Experimental ecology, Food webs, Freshwater ecology | Frederik De Laender | Andrew Barnes | 2020-06-15 09:04:53 | |
10 Aug 2023
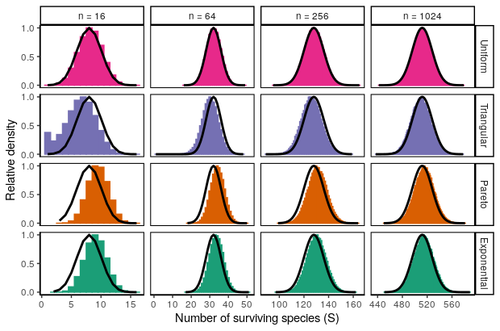
Coexistence of many species under a random competition-colonization trade-offAssembly in metacommunities driven by a competition-colonization tradeoff: more species in, more species outRecommended by Frederik De Laender based on reviews by Canan Karakoç and 1 anonymous reviewerThe output of a community model depends on how you set its parameters. Thus, analyses of specific parameter settings hardwire the results to specific ecological scenarios. Because more general answers are often of interest, one tradition is to give models a statistical treatment: one summarizes how model parameters vary across species, and then predicts how changing the summary, instead of the individual parameters themselves, would change model output. Arguably the best-known example is the work initiated by May, showing that the properties of a community matrix, encoding effects species have on each other near their equilibrium, determine stability (1,2). More recently, this statistical treatment has also been applied to one of community ecology’s more prickly and slippery subjects: community assembly, which deals with the question “Given some regional species pool, which species will be able to persist together at some local ecosystem?”. Summaries of how species grow and interact in this regional pool predict the fraction of survivors and their relative abundances, the kind of dynamics, and various kinds of stability (3,4). One common characteristic of such statistical treatments is the assumption of disorder: if species do not interact in too structured ways, simple and therefore powerful predictions ensue that often stand up to scrutiny in relatively ordered systems. 2. Allesina, S. & Tang, S. (2015). The stability–complexity relationship at age 40: a random matrix perspective. Population Ecology, 57, 63–75. https://doi.org/10.1007/s10144-014-0471-0 3. Bunin, G. (2016). Interaction patterns and diversity in assembled ecological communities. Preprint at http://arxiv.org/abs/1607.04734. 5. Miller, Z. R., Clenet, M., Libera, K. D., Massol, F. & Allesina, S. (2023). Coexistence of many species under a random competition-colonization trade-off. bioRxiv 2023.03.23.533867, ver 3 peer-reviewed and recommended by PCI Ecology. https://doi.org/10.1101/2023.03.23.533867 6. Serván, C. A. & Allesina, S. (2021). Tractable models of ecological assembly. Ecology Letters, 24, 1029–1037. https://doi.org/10.1111/ele.13702 | Coexistence of many species under a random competition-colonization trade-off | Zachary R. Miller, Maxime Clenet, Katja Della Libera, François Massol, Stefano Allesina | <p>The competition-colonization trade-off is a well-studied coexistence mechanism for metacommunities. In this setting, it is believed that coexistence of all species requires their traits to satisfy restrictive conditions limiting their similarit... | | Biodiversity, Coexistence, Colonization, Community ecology, Competition, Population ecology, Spatial ecology, Metacommunities & Metapopulations, Theoretical ecology | Frederik De Laender | 2023-03-30 20:42:48 | ||
05 Nov 2019
Crown defoliation decreases reproduction and wood growth in a marginal European beech population.Defoliation induces a trade-off between reproduction and growth in a southern population of BeechRecommended by Georges Kunstler based on reviews by 3 anonymous reviewersIndividuals ability to withstand abiotic and biotic stresses is crucial to the maintenance of populations at climate edge of tree species distribution. We start to have a detailed understanding of tree growth response and to a lesser extent mortality response in these populations. In contrast, our understanding of the response of tree fecundity and recruitment remains limited because of the difficulty to monitor it at the individual tree level in the field. Tree recruitment limitation is, however, crucial for tree population dynamics [1-2]. References [1] Clark, J. S. et al. (1999). Interpreting recruitment limitation in forests. American Journal of Botany, 86(1), 1-16. doi: 10.2307/2656950 | Crown defoliation decreases reproduction and wood growth in a marginal European beech population. | Sylvie Oddou-Muratorio, Cathleen Petit-Cailleux, Valentin Journé, Matthieu Lingrand, Jean-André Magdalou, Christophe Hurson, Joseph Garrigue, Hendrik Davi, Elodie Magnanou. | <p>1. Although droughts and heatwaves have been associated to increased crown defoliation, decreased growth and a higher risk of mortality in many forest tree species, their impact on tree reproduction and forest regeneration still remains underst... | | Climate change, Eco-evolutionary dynamics, Molecular ecology, Physiology, Population ecology | Georges Kunstler | 2018-11-20 13:29:42 | ||
21 Dec 2020
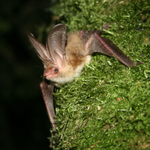
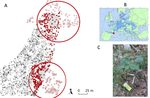
Influence of local landscape and time of year on bat-road collision risksAssessing bat-vehicle collision risks using acoustic 3D trackingRecommended by Gloriana Chaverri based on reviews by Mark Brigham and ? based on reviews by Mark Brigham and ?
The loss of biodiversity is an issue of great concern, especially if the extinction of species or the loss of a large number of individuals within populations results in a loss of critical ecosystem services. We know that the most important threat to most species is habitat loss and degradation (Keil et al., 2015; Pimm et al., 2014); the latter can be caused by multiple anthropogenic activities, including pollution, introduction of invasive species and fragmentation (Brook et al., 2008; Scanes, 2018). Roads are a major cause of habitat fragmentation, isolating previously connected populations and being a direct source of mortality for animals that attempt to cross them (Spellberg, 1998). References [1] Bartonička T, Andrášik R, Duľa M, Sedoník J, Bíl M (2018) Identification of local factors causing clustering of animal-vehicle collisions. The Journal of Wildlife Management, 82, 940–947. https://doi.org/10.1002/jwmg.21467 | Influence of local landscape and time of year on bat-road collision risks | Charlotte Roemer, Aurélie Coulon, Thierry Disca, and Yves Bas | <p>Roads impact bat populations through habitat loss and collisions. High quality habitats particularly increase bat mortalities on roads, yet many questions remain concerning how local landscape features may influence bat behaviour and lead to hi... | | Behaviour & Ethology, Biodiversity, Conservation biology, Human impact, Landscape ecology | Gloriana Chaverri | 2020-07-20 10:56:29 | ||
12 Apr 2023
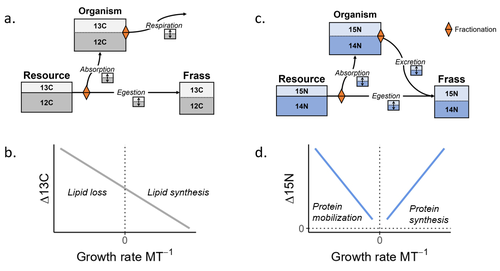
Feeding and growth variations affect δ13C and δ15N budgets during ontogeny in a lepidopteran larvaRefining our understanding how nutritional conditions affect 13C and 15N isotopic fractionation during ontogeny in a herbivorous insectRecommended by Gregor Kalinkat based on reviews by Anton Potapov and 1 anonymous reviewerUsing stable isotope fractionation to disentangle and understand the trophic positions of animals within the food webs they are embedded within has a long tradition in ecology (Post, 2002; Scheu, 2002). Recent years have seen increasing application of the method with several recent reviews summarizing past advancements in this field (e.g. Potapov et al., 2019; Quinby et al., 2020). In their new manuscript, Charberet and colleagues (2023) set out to refine our understanding of the processes that lead to nitrogen and carbon stable isotope fractionation by investigating how herbivorous insect larvae (specifically, the noctuid moth Spodoptera littoralis) respond to varying nutritional conditions (from starving to ad libitum feeding) in terms of stable isotopes enrichment. Though the underlying mechanisms have been experimentally investigated before in terrestrial invertebrates (e.g. in wolf spiders; Oelbermann & Scheu, 2002), the elegantly designed and adequately replicated experiments by Charberet and colleagues add new insights into this topic. Particularly, the authors provide support for the hypotheses that (A) 15N is disproportionately accumulated under fast growth rates (i.e. when fed ad libitum) and that (B) 13C is accumulated under low growth rates and starvation due to depletion of 13C-poor fat tissues. Applying this knowledge to field samples where feeding conditions are usually not known in detail is not straightforward, but the new findings could still help better interpretation of field data under specific conditions that make starvation for herbivores much more likely (e.g. droughts). Overall this study provides important methodological advancements for a better understanding of plant-herbivore interactions in a changing world. REFERENCES Charberet, S., Maria, A., Siaussat, D., Gounand, I., & Mathieu, J. (2023). Feeding and growth variations affect δ13C and δ15N budgets during ontogeny in a lepidopteran larva. bioRxiv, ver. 3 peer-reviewed and recommended by Peer Community in Ecology. https://doi.org/10.1101/2022.11.09.515573 Oelbermann, K., & Scheu, S. (2002). Stable Isotope Enrichment (δ 15N and δ 13C) in a Generalist Predator (Pardosa lugubris, Araneae: Lycosidae): Effects of Prey Quality. Oecologia, 130(3), 337–344. https://doi.org/10.1007/s004420100813 Post, D. M. (2002). Using stable isotopes to estimate trophic position: Models, methods, and assumptions. Ecology, 83(3), 703–718. https://doi.org/10.1890/0012-9658(2002)083[0703:USITET]2.0.CO;2 Potapov, A. M., Tiunov, A. V., & Scheu, S. (2019). Uncovering trophic positions and food resources of soil animals using bulk natural stable isotope composition. Biological Reviews, 94(1), 37–59. https://doi.org/10.1111/brv.12434 Quinby, B. M., Creighton, J. C., & Flaherty, E. A. (2020). Stable isotope ecology in insects: A review. Ecological Entomology, 45(6), 1231–1246. https://doi.org/10.1111/een.12934 Scheu, S. (2002). The soil food web: Structure and perspectives. European Journal of Soil Biology, 38(1), 11–20. https://doi.org/10.1016/S1164-5563(01)01117-7 | Feeding and growth variations affect δ13C and δ15N budgets during ontogeny in a lepidopteran larva | Samuel M. Charberet, Annick Maria, David Siaussat, Isabelle Gounand, Jérôme Mathieu | <p style="text-align: justify;">Isotopes are widely used in ecology to study food webs and physiology. The fractionation observed between trophic levels in nitrogen and carbon isotopes, explained by isotopic biochemical selectivity, is subject to ... | | Experimental ecology, Food webs, Physiology | Gregor Kalinkat | 2022-11-16 15:23:31 | ||
24 May 2024
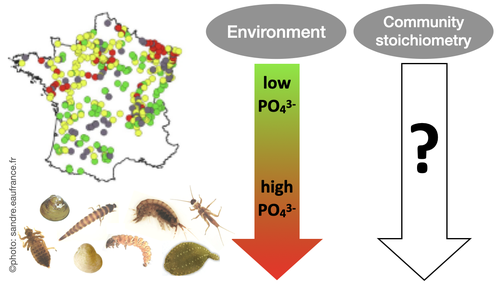
Effects of water nutrient concentrations on stream macroinvertebrate community stoichiometry: a large-scale studyThe influence of water phosphorus and nitrogen loads on stream macroinvertebrate community stoichiometryRecommended by Huihuang Chen based on reviews by Thomas Guillemaud, Jun Zuo and 1 anonymous reviewer
The manuscript by Beck et al. (2024) investigates the effects of water phosphorus and nitrogen loads on stream macroinvertebrate community stoichiometry across France. Utilizing data from over 1300 standardized sampling events, this research finds that community stoichiometry is significantly influenced by water phosphorus concentration, with the strongest effects at low nitrogen levels. The results demonstrate that the assumptions of Ecological Stoichiometry Theory apply at the community level for at least two dominant taxa and across a broad spatial scale, with probable implications for nutrient cycling and ecosystem functionality. This manuscript contributes to ecological theory, particularly by extending Ecological Stoichiometry Theory to include community-level interactions, clarifying the impact of nutrient concentrations on community structure and function, and informing nutrient management and conservation strategies. In summary, this study not only addresses a gap in community-level stoichiometric research but also delivers crucial empirical support for advancing ecological science and promoting environmental stewardship. References Beck M, Billoir E, Usseglio-Polatera P, Meyer A, Gautreau E and Danger M (2024) Effects of water nutrient concentrations on stream macroinvertebrate community stoichiometry: a large-scale study. bioRxiv, 2024.02.01.574823, ver. 2 peer-reviewed and recommended by Peer Community in Ecology. https://doi.org/10.1101/2024.02.01.574823 | Effects of water nutrient concentrations on stream macroinvertebrate community stoichiometry: a large-scale study | Miriam Beck, Elise Billoir, Philippe Usseglio-Polatera, Albin Meyer, Edwige Gautreau, Michael Danger | <p>Basal resources generally mirror environmental nutrient concentrations in the elemental composition of their tissue, meaning that nutrient alterations can directly reach consumer level. An increased nutrient content (e.g. phosphorus) in primary... | | Community ecology, Ecological stoichiometry | Huihuang Chen | Thomas Guillemaud, Jun Zuo, Anonymous | 2024-02-02 10:14:01 | |
07 Oct 2019
Which pitfall traps and sampling efforts should be used to evaluate the effects of cropping systems on the taxonomic and functional composition of arthropod communities?On the importance of experimental design: pitfall traps and arthropod communitiesRecommended by Ignasi Bartomeus based on reviews by Cécile ALBERT and Matthias Foellmer
Despite the increasing refinement of statistical methods, a robust experimental design is still one of the most important cornerstones to answer ecological and evolutionary questions. However, there is a strong trade-off between a perfect design and its feasibility. A common mantra is that more data is always better, but how much is enough is complex to answer, specially when we want to capture the spatial and temporal variability of a given process. Gardarin and Valantin-Morison [1] make an effort to answer these questions for a practical case: How many pitfalls traps, of which type, and over which extent, do we need to detect shifts in arthropod community composition in agricultural landscapes. There is extense literature on how to approach these challenges using preliminary data in combination with simulation methods [e.g. 2], but practical cases are always welcomed to illustrate the complexity of the decisions to be made. A key challenge in this situation is the nature of simplified and patchy agricultural arthropod communities. In this context, small effect sizes are expected, but those small effects are relevant from an ecological point of view because small increases at low biodiversity may produce large gains in ecosystem functioning [3]. References [1] Gardarin, A. and Valantin-Morison, M. (2019). Which pitfall traps and sampling efforts should be used to evaluate the effects of cropping systems on the taxonomic and functional composition of arthropod communities? Zenodo, 3468920, ver. 3 peer-reviewed and recommended by PCI Ecology. doi: 10.5281/zenodo.3468920 | Which pitfall traps and sampling efforts should be used to evaluate the effects of cropping systems on the taxonomic and functional composition of arthropod communities? | Antoine Gardarin and Muriel Valantin-Morison | <p>1. Ground dwelling arthropods are affected by agricultural practices, and analyses of their responses to different crop management are required. The sampling efficiency of pitfall traps has been widely studied in natural ecosystems. In arable a... | | Agroecology, Biodiversity, Biological control, Community ecology | Ignasi Bartomeus | 2019-01-08 09:40:14 | ||
07 Aug 2023
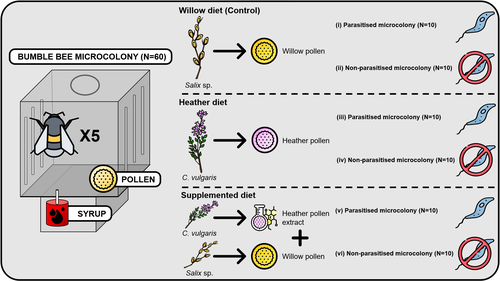
Heather pollen is not necessarily a healthy diet for bumble beesThe importance of understanding bee nutritionRecommended by Ignasi Bartomeus based on reviews by Cristina Botías and 1 anonymous reviewer
Contrasting with the great alarm on bee declines, it is astonishing how little basic biology we know about bees, including on abundant and widespread species that are becoming model species. Plant-pollinator relationships are one of the cornerstones of bee ecology, and researchers are increasingly documenting bees' diets. However, we rarely know which effects feeding on different flowers has on bees' health. This paper (Tourbez et al. 2023) uses an elegant experimental setting to test the effect of heather pollen on bumblebees' (Bombus terrestris) reproductive success. This is a timely question as heather is frequently used by bumblebees, and its nectar has been reported to reduce parasite infections. In fact, it has been suggested that bumblebees can medicate themselves when infected (Richardson et al. 2014), and the pollen of some Asteraceae has been shown to help them fight parasites (Gekière et al. 2022). The starting hypothesis is that heather pollen contains flavonoids that might have a similar effect. Unfortunately, Tourbez and collaborators do not support this hypothesis, showing a negative effect of heather pollen, in particular its flavonoids, in bumblebees offspring, and an increase in parasite loads when fed on flavonoids. This is important because it challenges the idea that many pollen and nectar chemical compounds might have a medicinal use, and force us to critically analyze the effect of chemical compounds in each particular case. The results open several questions, such as why bumblebees collect heather pollen, or in which concentrations or pollen mixes it is deleterious. A limitation of the study is that it uses micro-colonies, and extrapolating this to real-world conditions is always complex. Understanding bee declines require a holistic approach starting with bee physiology and scaling up to multispecies population dynamics. References Gekière, A., Semay, I., Gérard, M., Michez, D., Gerbaux, P., & Vanderplanck, M. 2022. Poison or Potion: Effects of Sunflower Phenolamides on Bumble Bees and Their Gut Parasite. Biology, 11(4), 545. https://doi.org/10.3390/biology11040545 Richardson, L.L., Adler, L.S., Leonard, A.S., Andicoechea, J., Regan, K.H., Anthony, W.E., Manson, J.S., & Irwin, R.E. 2015. Secondary metabolites in floral nectar reduce parasite infections in bumblebees. Proceedings of the Royal Society of London B: Biological Sciences 282 (1803), 20142471. https://doi.org/10.1098/rspb.2014.2471 Tourbez, C., Semay, I., Michel, A., Michez, D., Gerbaux, P., Gekière A. & Vanderplanck, M. 2023. Heather pollen is not necessarily a healthy diet for bumble bees. Zenodo, ver 3, reviewed and recommended by PCI Ecology. https://doi.org/10.5281/zenodo.8192036 | Heather pollen is not necessarily a healthy diet for bumble bees | Clément Tourbez, Irène Semay, Apolline Michel, Denis Michez, Pascal Gerbaux, Antoine Gekière, Maryse Vanderplanck | <p>There is evidence that specialised metabolites of flowering plants occur in both vegetative parts and floral resources (i.e., pollen and nectar), exposing pollinators to their biological activities. While such metabolites may be toxic to bees, ... | | Botany, Chemical ecology, Host-parasite interactions, Pollination, Zoology | Ignasi Bartomeus | 2023-04-10 21:22:34 | ||
07 Aug 2023
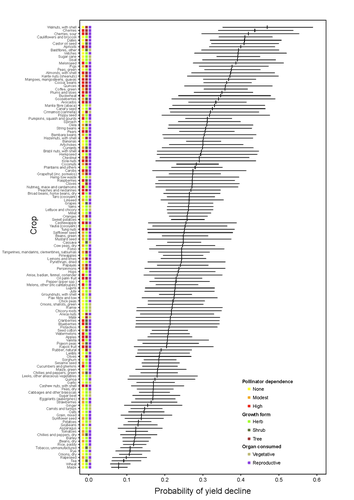
Being a tree crop increases the odds of experiencing yield declines irrespective of pollinator dependenceThe complexities of understanding why yield is decliningRecommended by Ignasi Bartomeus based on reviews by Nicolas Deguines and 1 anonymous reviewer
Despite the repeated mantra that "correlation does not imply causation", ecological studies not amenable to experimental settings often rely on correlational patterns to infer the causes of observed patterns. In this context, it's of paramount importance to build a plausible hypothesis and take into account potential confounding factors. The paper by Aizen and collaborators (2023) is a beautiful example of how properly unveil the complexities of an intriguing pattern: The decline in yield of some crops over the last few decades. This is an outstanding question to solve given the need to feed a growing population without destroying the environment, for example by increasing the area under cultivation. Previous studies suggested that pollinator-dependent crops were more susceptible to suffering yield declines than non-pollinator-dependent crops (Garibaldi et al 2011). Given the actual population declines of some pollinators, especially in agricultural areas, this correlative evidence was quite appealing to be interpreted as a causal effect. However, as elegantly shown by Aizen and colleagues in this paper, this first analysis did not account for other alternative explanations, such as the effect of climate change on other plant life-history traits correlated with pollinator dependence. Plant life-history traits do not vary independently. For example, trees are more likely to be pollinator-dependent than herbs (Lanuza et al 2023), which can be an important confounding factor in the analysis. With an elegant analysis and an impressive global dataset, this paper shows that the declining trend in the yield of some crops is most likely associated with their life form than with their dependence on pollinators. This does not imply that pollinators are not important for crop yield, but that the decline in their populations is not leaving a clear imprint in the global yield production trends once accounted for the technological and agronomic improvements. All in all, this paper makes a key contribution to food security by elucidating the factors beyond declining yield trends, and is a brave example of how science can self-correct itself as new knowledge emerges. References Aizen, M.A., Gleiser, G., Kitzberger T. and Milla R. 2023. Being A Tree Crop Increases the Odds of Experiencing Yield Declines Irrespective of Pollinator Dependence. bioRxiv, 2023.04.27.538617, ver 2, peer-reviewed and recommended by PCI Ecology. https://doi.org/10.1101/2023.04.27.538617 Lanuza, J.B., Rader, R., Stavert, J., Kendall, L.K., Saunders, M.E. and Bartomeus, I. 2023. Covariation among reproductive traits in flowering plants shapes their interactions with pollinators. Functional Ecology 37: 2072-2084. https://doi.org/10.1111/1365-2435.14340 Garibaldi, L.A., Aizen, M.A., Klein, A.M., Cunningham, S.A. and Harder, L.D. 2011. Global growth and stability of agricultural yield decrease with pollinator dependence. Proceedings of the National Academy of Sciences, 108: 5909-5914. https://doi.org/10.1073/pnas.1012431108 | Being a tree crop increases the odds of experiencing yield declines irrespective of pollinator dependence | Marcelo A. Aizen, Gabriela Gleiser, Thomas Kitzberger, and Rubén Milla | <p>Crop yields, i.e., harvestable production per unit of cropland area, are in decline for a number of crops and regions, but the drivers of this process are poorly known. Global decreases in pollinator abundance and diversity have been proposed a... | | Agroecology, Climate change, Community ecology, Demography, Facilitation & Mutualism, Life history, Phenotypic plasticity, Pollination, Terrestrial ecology | Ignasi Bartomeus | 2023-05-02 18:54:44 | ||
03 Mar 2022

Artificial reefs geographical location matters more than its age and depth for sessile invertebrate colonization in the Gulf of Lion (NorthWestern Mediterranean Sea)A longer-term view on benthic communities on artificial reefs: it’s all about locationRecommended by James Davis Reimer based on reviews by 2 anonymous reviewersIn this study by Blouet, Bramanti, and Guizen (2022), the authors aim to tackle a long-standing data gap regarding research on marine benthic communities found on artificial reefs. The study is well thought out, and should serve as an important reference on this topic going forward. Blouet S, Bramanti L, Guizien K (2022) Artificial reefs geographical location matters more than shape, age and depth for sessile invertebrate colonization in the Gulf of Lion (NorthWestern Mediterranean Sea). bioRxiv, 2021.10.08.463669, ver. 4 peer-reviewed and recommended by Peer Community in Ecology. https://doi.org/10.1101/2021.10.08.463669 | Artificial reefs geographical location matters more than its age and depth for sessile invertebrate colonization in the Gulf of Lion (NorthWestern Mediterranean Sea) | sylvain blouet, Katell Guizien, lorenzo Bramanti | <p>Artificial reefs (ARs) have been used to support fishing activities. Sessile invertebrates are essential components of trophic networks within ARs, supporting fish productivity. However, colonization by sessile invertebrates is possible only af... | | Biodiversity, Biogeography, Colonization, Ecological successions, Life history, Marine ecology | James Davis Reimer | 2021-10-11 10:21:36 |


