
The complexities of understanding why yield is declining
 based on reviews by Nicolas Deguines and 1 anonymous reviewer
Being a tree crop increases the odds of experiencing yield declines irrespective of pollinator dependence
Abstract
Recommendation: posted 06 August 2023, validated 07 August 2023
Bartomeus, I. (2023) The complexities of understanding why yield is declining. Peer Community in Ecology, 100537. https://doi.org/10.24072/pci.ecology.100537
Recommendation
Despite the repeated mantra that "correlation does not imply causation", ecological studies not amenable to experimental settings often rely on correlational patterns to infer the causes of observed patterns. In this context, it's of paramount importance to build a plausible hypothesis and take into account potential confounding factors. The paper by Aizen and collaborators (2023) is a beautiful example of how properly unveil the complexities of an intriguing pattern: The decline in yield of some crops over the last few decades. This is an outstanding question to solve given the need to feed a growing population without destroying the environment, for example by increasing the area under cultivation. Previous studies suggested that pollinator-dependent crops were more susceptible to suffering yield declines than non-pollinator-dependent crops (Garibaldi et al 2011). Given the actual population declines of some pollinators, especially in agricultural areas, this correlative evidence was quite appealing to be interpreted as a causal effect. However, as elegantly shown by Aizen and colleagues in this paper, this first analysis did not account for other alternative explanations, such as the effect of climate change on other plant life-history traits correlated with pollinator dependence. Plant life-history traits do not vary independently. For example, trees are more likely to be pollinator-dependent than herbs (Lanuza et al 2023), which can be an important confounding factor in the analysis. With an elegant analysis and an impressive global dataset, this paper shows that the declining trend in the yield of some crops is most likely associated with their life form than with their dependence on pollinators. This does not imply that pollinators are not important for crop yield, but that the decline in their populations is not leaving a clear imprint in the global yield production trends once accounted for the technological and agronomic improvements. All in all, this paper makes a key contribution to food security by elucidating the factors beyond declining yield trends, and is a brave example of how science can self-correct itself as new knowledge emerges.
References
Aizen, M.A., Gleiser, G., Kitzberger T. and Milla R. 2023. Being A Tree Crop Increases the Odds of Experiencing Yield Declines Irrespective of Pollinator Dependence. bioRxiv, 2023.04.27.538617, ver 2, peer-reviewed and recommended by PCI Ecology. https://doi.org/10.1101/2023.04.27.538617
Lanuza, J.B., Rader, R., Stavert, J., Kendall, L.K., Saunders, M.E. and Bartomeus, I. 2023. Covariation among reproductive traits in flowering plants shapes their interactions with pollinators. Functional Ecology 37: 2072-2084. https://doi.org/10.1111/1365-2435.14340
Garibaldi, L.A., Aizen, M.A., Klein, A.M., Cunningham, S.A. and Harder, L.D. 2011. Global growth and stability of agricultural yield decrease with pollinator dependence. Proceedings of the National Academy of Sciences, 108: 5909-5914. https://doi.org/10.1073/pnas.1012431108

The recommender in charge of the evaluation of the article and the reviewers declared that they have no conflict of interest (as defined in the code of conduct of PCI) with the authors or with the content of the article. The authors declared that they comply with the PCI rule of having no financial conflicts of interest in relation to the content of the article.
This work was supported by grants from the National Fund for Scientific and Technological Research of Argentina (FONCYT) [PICT 2015-2333, PICT 2018-2145] and the Ministry of Science and Innovation of Spain (MICINN) [PID2021-122296NB-I00], and a sabbatical fellowship from the Wissenschaftskolleg zu Berlin.
Evaluation round #1
DOI or URL of the preprint: https://doi.org/10.1101/2023.04.27.538617
Version of the preprint: 1
Author's Reply, 02 Aug 2023
Decision by Ignasi Bartomeus, posted 07 Jul 2023, validated 07 Jul 2023
Dear Authors,
This is a very nice and compelling paper challenging the mechanisms behind previously reported trends showing that pollinator-dependent crops are declining in yield growth faster than non-dependent crops. Exploring confounding variables such as growth form is a clever and needed addition. As pointed out by Reviewer 1, global analyses are powerful, but data management is complex, and the devil is in the details. Hence, both reviewers make minor but fair questions about the choices taken to manipulate the original data. I think backing up some of their concerns with additional supporting analysis (when data quality and quantity permits) will ensure the results are robust.
In particular, I am concerned with the interpretation of growth rate. In the text is mentioned that “a negative growth rate can be taken as evidence of long-term yield decline”. In parts of the text is unclear what "yield decline" refers to. My understanding is that behind these trends, we can find changes in the area occupied by the crop, changes in management practices, and changes in production per hectare. I understand that this last mechanism (changes in production per area) is the most tightly linked to pollinator declines or climate change effects, which is the focus of the introduction/discussion. Is there any elegant way to get closer to analyzing trends in yield per cultivated area (i.e. is area cultivated per year and crop available)? Alternatively, I think this should be noted early in the introduction to avoid any misinterpretation of the results. Also, Fig 1 is intriguing, as it seems the extreme years are highly influential. Do you think starting in 1962 or cutting off in 2019 would change the results?
I also have a suggestion to reinforce the main analysis. I think it will be illustrative to add a variance partitioning plot. This can be done using a Venn diagram, where you calculate the proportion of variance explained by the model with only one variable (model 1a), the proportion of variance explained by the other one (model 1b), and the joint explained variance (model 2). I might miss some technical details here, but I think exploring this would help the story.
Lastly, I miss some discussions on recent advances in plant trait correlations and trade-offs, where the growth form and pollinator dependence are discussed along with other traits. e.g. Lanuza et al. 2023 (10.1111/1365-2435.14340), Friedman, 2020 (https:// doi.org/10.1146/annurev-ecolsys-110218-024638 ); Paterno et al., 2020 (https://doi.org/10.1073/pnas.19106 31117 ); Roddy et al., 2021 (https:// doi.org/10.1111/nph.16823 ).
I think the changes proposed by reviewers and myself should be viewed as a robustness check, but they are mostly minor concerns. I am looking forward to seeing the final version of this stimulating paper.
Best,
Ignasi Bartomeus.
Reviewed by anonymous reviewer 1, 22 May 2023
In this manuscript, Aizen et al., use a big dataset with temporal series in crop yields to study how yields changed in the last decades, aiming to examine if crop pollinator dependence and crop type (tree, bush or herb) can predict the probability of the sign of this trend (i.e., decrease or increase). I find that the study is interesting, it is framed and presented in a very clever manner, and nicely written. By the type of analyses conducted and the complexity of the issue (i.e., many possible confounding factors understandably not considered due to the lack of data at this temporal and spatial scale), I would take the results with caution. Still, I think that the study represents a nice try to disentangle some of the potential drivers affecting trends in crop yields worldwide.
Abstract
L. 27. Impressive numbers!
L 37. Why climate change? Could be due to a number of different reasons, such as plant diseases, more pest species or pest outbreaks, loss of natural enemies, loss of soil fertility, lack of water in recent years (linked or not to climate change), or just the lack of what you mention in your first introduction paragraph. In Africa there is a less mechanized and intensified type of agriculture, so some of the possible reasons might affect more to this region too. In the study, explanatory variables related to climate change are not tested, then why not finishing with something more related to the actual results such as: “These results suggest that pollinator decline is not the main reason behind tree crop productivity loss”.
Introduction
L 77. Remove “to any extent”. Some of these crops seem to have some benefits if they are cross pollinated by pollinators (e.g., https://doi.org/10.17660/ActaHortic.2012.949.27).
L130. “Because of”, or “due to”?
Methods
L 139-143. Good choice! Also, another important reason to calculate trends at the country level, is the influence of political aspects such as subsidies to implement watering systems or to increase mechanization. These can impact trends in yields strongly and depend on country. I would even hypothesize that country GDP (or PPP) might be related to long term trends in yield.
L 139-143. I know that yield is by definition the “production by area”, but I would define this somewhere just to make it clear from the beginning.
L161-163. Not sure this is the best, because you leave out the uncertainty about the trend (the error), which might be very high in some cases, and low in others. Could probably be a better approach and worth exploring to use a triple interaction in the models (you have a big dataset that should be able to handle it), something like this (simplified): Yield * Year * Pollinator dependence, or Yield * Year * Crop type (tree vs. bush. vs. herb). With this model you will also account for the uncertainty in the trends.
I am not a fan of this approach (categorize mean trend into “increase” or “decline”). You miss all the information about the effect size by categorizing trends into “decline” or “increase”, leaving out, in addition, the uncertainty of the trends. Basically, there will be a number of non-significant trends that you are forcing into the models as instances (or replicates) of “Full probability of yield decline” and “Full probability of yield increase”.
L162: Note that “an average growth rate <0” means that a slope of -0.4 was rounded to 0 (no decline). Specify the number of decimals used.
L190: The crop species as random factor is key here, because the slop estimates that you are using as response variable will depend strongly on the yields and crop type, very nice!
L 194: I think that including the country random factor nested within the region random factor would be more accurate.
L198-202: “All the mixed models […] included the (log10) cumulative total harvested area (in square kilometres) […] as covariates to account for variation among crops and among countries in the probability of yield decline that could relate to the agricultural relevance of the crop and country, respectively” Regarding the harvested area, total harvested area by country might reflect more strongly the size of the country than the relevance of the crop in a particular country. For instance, apple production is very important in Switzerland and in China, but the total harvested are is orders of magnitude smaller in the former country. Maybe a better indicator for what you want is the amount of cumulative harvested area relative to the cumulative agricultural area in the country (also provided by FAO). Regarding country, I understand that you want to correct for the importance of agriculture in a given country. I do not fully understand why you expect that this will be related to the probability of yield decline, but I would correct at least for the size of the country here. Agriculture can be very important in a small country. If you want to explore the proposed triple interaction model I suggested before and it does not work, I would remove these covariates, that are taking many degrees of freedom and are probably not fulfilling their purpose as they enter the model currently.
L219-220: Wow! I am not sure that this extra analysis was necessary. It seems to have added a lot of complexity to the project and you were not looking for eco-evolutionary reasons of yield declines. I cannot think of strong reasons to argue that the phylogeny of a species per se is a main driver of yield increases or decline in the last 60 years. Still, I congratulate the authors for their great effort to account for a wide arrange of different aspects.
244-255: This statement is not really correct if the trends were not free of strong uncertainty.
248: “The first year in the time series”. A bit confusing sentence, maybe try to clarify it?
Results
Confidence intervals are only provided for the model 0 and line 296. It would be nice to see significance tests or confidence intervals for the rest of the figures provided. Otherwise, it might seem that your results are merely descriptive and I do not think that is the case.
Discussion
Nice and carefully worded discussion!
“Pollinator dependence cannot be considered the primary driver of yield decline in most pollinator-dependent crops”. This might be a nice take home message of your paper.
L 342: Yes, I think that there are many confounding factors, such as the degree of management intensification, or new varieties commercialized that are much more important in terms of yield when comparing many different crops at the global scale.
Concluding remarks
L 421-423: “For example, we might have reached a misleading conclusion about the relationship between pollinator dependence and yield decline if we did not consider that pollinator dependence is associated with growth form.” Good point, I agree. However, the same applies for some factors that could not be considered (e.g., degree of intensification or mechanization).
Figures
Figure 2 is very interesting. Together with some data shown in the paper makes me think that crop yield decline is not really a general problem. The cut-off in the map is set to 0.6, which means that very few countries will have an overall probability of crop yield decline over 50%. Good to see that probability of declining crop yields has been overall very low worldwide.
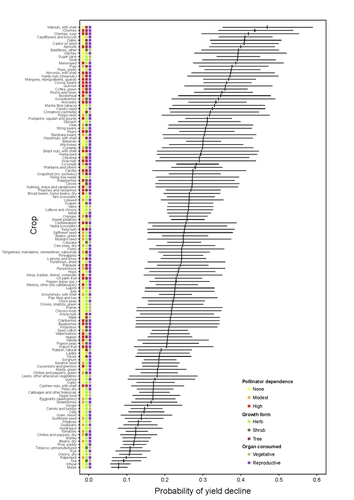
Fig 4. Interesting that even when the probability of yield decline is higher in trees, it is still quite low.
Fig S2. Name of crops is too blurred.
https://doi.org/10.24072/pci.ecology.100537.rev11
Reviewed by Nicolas Deguines, 06 Jul 2023
General comments
I really enjoyed reading this very interesting and well-written manuscript authored by Aizen and colleagues. I rarely had so few things to say in a review, and I think this paper will be a very nice contribution.
In their study, they analyzed six decades of crop yield data at a global scale (136 crops in total, from 163 countries) and investigated if declines in long-term yield growth rates are associated with pollinator-dependence (“None”, “Modest”, “High”) or growth form (“Herb”, “Shrub”, “Tree”). This is an important consideration because previous study investigating long-term global yields did not consider other plant traits that could be non-randomly associated with pollinator dependence (such as growth form, as is shown here) and be the main factor of yield growth decline. The aim of the study is to untangle these factors (pollinator dependence and growth form).
The study is really well presented from the beginning to the end. The methodology is very well explained and sound.
All these positive points being said, there are a few points that might need to be addressed. Details are provided below and I only here introduce the main one. I wonder to what extent the simplification of the pollinator-dependence variable into three categories was necessary and whether or not keeping the full gradient could change the result (keeping the details might be possible and could be relevant; I suggest a way to do that in the detailed comment below about L169).
Detailed comments
### Introduction ###
L69, 71, 97-125: At first, only ‘growth form’ is mentioned (L69). In the next sentence, it becomes ‘growth form and other functional traits’ and I rather agree with this (and so do the authors as, later, in the paragraph really introducing the literature about this aspect, growth form and associated traits are considered, given how plant traits are often correlated). Perhaps just modify at the first mention ?
L120: I would cut this long sentence in two, between “outbreaks” and “whereas”.
### Methods ###
L159-163: This part is already about how data are analyzed; it is the first step. I think it should be moved at the beginning of the following section (i.e. L182 Data analyses).
L169: about the unbalance in number of crops per combination of “growth form” and “5-levels pollinator dependence”. First, it would be useful to show the table (appendix) so that readers could make their opinion. Or at least give some numbers to back-up your decision to simplify the pollinator dependence gradient into three categories. Second, I wonder if an alternative could be to keep the details and analyze this variable as a numeric instead of as categorical. Doing so, the ‘unbalance’ would not be much of an issue (at least for running the glmm’s). And perhaps the effect of pollinator dependence is a gradual one that could be weaken/hidden when lumping categories. In a previous paper, my co-authors and I followed an approach where categories where not lumped and considered as a numeric variable (Deguines et al. 2014). Could author consider a change in their use of the pollinator-dependence variable and, if not, provide reasons why?
L196-197: I was not sure that the 3 two-way interactions were included before having a look at the table in the appendix summarizing the models’ results. I even thought that perhaps the three-way interaction was included. Perhaps this sentence should be rephrased to make this clearer?
Also, I strongly suggest to move Table S1 from the Appendix to the main text. I think it helps in seeing the broad methodological approach.
L198-200: All but model GLMM_0 include as fixed effects the (log10) cumulative total harvested area per crop and country. Why not include these effects in GLMM_0? I think it’s to be able to get “raw” descriptive estimates of growth rate decline by crop and country, without them being adjusted to these two effects. But I am not sure and I suggest to clarify this point.
L199: why was the area variables log10 transformed? Was this done to deal with convergence issue of the GLMM models? (I suppose that these variables reached quite high values, which sometimes make glmmTMB models fail to converge). Authors described very well the rest of the methods but not that point.
L219-241: all this is very well-explained. Yet, authors start to explain that it is not necessary to account for phylogeny if model residuals are not associated with the phylogeny. But, in the end, authors did make models that do include ‘a correlation matrix based on the phylogenetic distances between crops”, in order to compare their AIC’s with models without the phylogenetic distances included. On one hand, it’s nice because it shows how this can be done and authors make a double-check of the robustness of their results to phylogenetical influences. But on the other hand, one wonder why doing the phylogeny-accounted-for models at all and not just check the residuals.
If keeping all this (which can make sense), I would only suggest to change the beginning of that paragraph and keep the part about “checking model residuals against phylogeny is enough” for the end (after writing that AIC are compared).
L241+: were there any checks of model residuals (under/over-dispersion, …), for example using the DHARMa package (Hartig 2021)?
### Results ###
L269: I would use “pollinator-independent” instead of “pollinator-nondependent”, simply for consistency throughout the manuscript.
L277: I am not entirely sure of the need of GLMM_1 models. One of the advantage of models over ‘simple’ tests is that multiple explanatory variables can be considered together, i.e. their effects be tested and adjusted for one another. I think authors want to insist on the fact that their final model do account for the fact that two main variables tested are associated (L264 and Figure 3). In my opinion, it is not necessary. But I can see that it can be convincing for readers not very familiar with statistical analyses. Also, I must admit that the paper is very well-written and it did not feel complicated to read through these multiple models. So, I would leave it to the authors to keep it as is or reduce their MS by cutting-off GLMM_1 and 2 models.
L279: I would remove “practically” to avoid confusion (it may be my level of English ; but I understood it as perhaps the effect was still slightly statistically significant, whereas its associated P-value is well-above)
L285: I suggest removing “some”. It sounds like the effect of the interaction may be weaker than the first presented, while, if anything, it rather is the opposite.
L293: replace “corrected by” with “adjusted to”, and potentially complete the sentence by adding after effects “, as they were all included as fixed effects in our models.”
L297-302: I would incorporate in the methods the results of multicollinearity checks (L215) and phylogenetic inclusion in the models (L241) rather than having that at the end of the Results. Perhaps this was done to insist on the fact that these were no issue in your analyses and that the two factors are well untangled. But it seems to me it would be better in the Methods (readers are then reassured there).
### Discussion ###
L333: is human pollination a common practice over all Asia? A hand pollination picture is often used and re-used over the media, but I have never read any numbers about it and I considered this practice to be anecdotical and limited to a very local part of China. Is there a reference to justify that it is used over a large area / number of crops? If not, perhaps reformulate the sentence to better frame this information (or remove it).
L390: add “long-term” before “decline”?
### Conclusion ###
L428-430: In this last sentence, what do authors mean here by ‘reductionist’ (need for research looking into the physiological/biological aspects of why the yield of tree growth form are more sensitive to climate change)? I think this needs to be clarified.
Also, as is, the sentence is – I think – not very logical. Perhaps a word was forgotten between “In addition to” and “the need for more”, such as “highlighting” (it would match the 2nd part of the sentence: ‘our study identified…’
### Figures ###
## Figure 1:
To avoid misinterpretation, I suggest making the Y-axis of the two panel of the same range, i.e. from 0% to about 15% (enough for the bottom panel and the top panel).
Also, the font used for both zeros differ.
## Figure 2:
Could author find a way to show on this figure the number of crops per country? I don’t have in mind a nice way to do that. Perhaps a 2nd map, below that one (or in the appendix)? If that is not possible, it would be useful to provide some information in the text about the range of number of crops per country, and the overall median.
### Supplementary information ###
Fig S1 & S2: printed on a A4 page, the y axis is not readable because the font is too small. The figure could be wider on the page and/or find a way to use a greater font size.
Table S1: I already said it above but, just in case, I suggest to move this into the main text of the manuscript.
Also, in part D.: add “phylogenetic” between “Residuals’” and “signal”?
References used above
Deguines N, Jono C, Baude M, et al (2014) Large-scale trade-off between agricultural intensification and crop pollination services. Frontiers in Ecology and the Environment 12:212–217. https://doi.org/10.1890/130054
Hartig F (2021) DHARMa: Residual diagnostics for hierarchical (multi-Level / mixed) regression models
https://doi.org/10.24072/pci.ecology.100537.rev12


