
Latest recommendations

| Id | Title | Authors▲ | Abstract | Picture | Thematic fields | Recommender | Reviewers | Submission date | |
|---|---|---|---|---|---|---|---|---|---|
01 Apr 2019
The inherent multidimensionality of temporal variability: How common and rare species shape stability patternsDiversity-Stability and the Structure of PerturbationsRecommended by Kevin Cazelles and Kevin Shear McCann based on reviews by Frederic Barraquand and 1 anonymous reviewer and Kevin Shear McCann based on reviews by Frederic Barraquand and 1 anonymous reviewer
In his 1972 paper “Will a Large Complex System Be Stable?” [1], May challenges the idea that large communities are more stable than small ones. This was the beginning of a fundamental debate that still structures an entire research area in ecology: the diversity-stability debate [2]. The most salient strength of May’s work was to use a mathematical argument to refute an idea based on the observations that simple communities are less stable than large ones. Using the formalism of dynamical systems and a major results on the distribution of the eigen values for random matrices, May demonstrated that the addition of random interactions destabilizes ecological communities and thus, rich communities with a higher number of interactions should be less stable. But May also noted that his mathematical argument holds true only if ecological interactions are randomly distributed and thus concluded that this must not be true! This is how the contradiction between mathematics and empirical observations led to new developments in the study of ecological networks. References [1] May, Robert M (1972). Will a Large Complex System Be Stable? Nature 238, 413–414. doi: 10.1038/238413a0 | The inherent multidimensionality of temporal variability: How common and rare species shape stability patterns | Jean-François Arnoldi, Michel Loreau, Bart Haegeman | <p>Empirical knowledge of ecosystem stability and diversity-stability relationships is mostly based on the analysis of temporal variability of population and ecosystem properties. Variability, however, often depends on external factors that act as... | | Biodiversity, Coexistence, Community ecology, Competition, Interaction networks, Theoretical ecology | Kevin Cazelles | 2018-10-02 14:01:03 | ||
18 Dec 2019
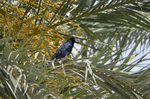
Validating morphological condition indices and their relationship with reproductive success in great-tailed gracklesAre condition indices positively related to each other and to fitness?: a test with gracklesRecommended by Marcos Mendez based on reviews by Javier Seoane and Isabel López-RullReproductive succes, as a surrogate of individual fitness, depends both on extrinsic and intrinsic factors [1]. Among the intrinsic factors, resource level or health are considered important potential drivers of fitness but exceedingly difficult to measure directly. Thus, a host of proxies have been suggested, known as condition indices [2]. The question arises whether all condition indices consistently measure the same "inner state" of individuals and whether all of them similarly correlate to individual fitness. In this preregistration, Berens and colleagues aim to answer this question for two common condition indices, fat score and scaled mass index (Fig. 1), using great-tailed grackles as a model system. Although this question is not new, it has not been satisfactorily solved and both reviewers found merit in the attempt to clarify this matter. References [1] Roff, D. A. (2001). Life history evolution. Oxford University Press, Oxford. | Validating morphological condition indices and their relationship with reproductive success in great-tailed grackles | Jennifer M. Berens, Corina J. Logan, Melissa Folsom, Luisa Bergeron, Kelsey B. McCune | Morphological variation among individuals has the potential to influence multiple life history characteristics such as dispersal, migration, reproductive fitness, and survival (Wilder, Raubenheimer, and Simpson (2016)). Theoretically, individuals ... | | Behaviour & Ethology, Conservation biology, Demography, Morphometrics, Preregistrations, Zoology | Marcos Mendez | 2019-08-05 20:05:56 | ||
30 Jan 2020
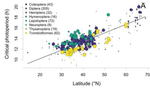
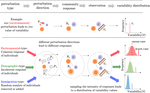
Diapause is not selected as a bet-hedging strategy in insects: a meta-analysis of reaction norm shapesWhen to diapause or not to diapause? Winter predictability is not the answerRecommended by Bastien Castagneyrol based on reviews by Kévin Tougeron, Md Habibur Rahman Salman and 1 anonymous reviewerWinter is a harsh season for many organisms that have to cope with food shortage and potentially lethal temperatures. Many species have evolved avoidance strategies. Among them, diapause is a resistance stage many insects use to overwinter. For an insect, it is critical to avoid lethal winter temperatures and thus to initiate diapause before winter comes, while making the most of autumn suitable climatic conditions [1,2]. Several cues can be used to appreciate that winter is coming, including day length and temperature [3]. But climate changes, temperatures rise and become more variable from year to year, which imposes strong pressure upon insect phenology [4]. How can insects adapt to changes in the mean and variance of winter onset? References [1] Dyck, H. V., Bonte, D., Puls, R., Gotthard, K., and Maes, D. (2015). The lost generation hypothesis: could climate change drive ectotherms into a developmental trap? Oikos, 124(1), 54–61. doi: 10.1111/oik.02066 | Diapause is not selected as a bet-hedging strategy in insects: a meta-analysis of reaction norm shapes | Jens Joschinski and Dries Bonte | Many organisms escape from lethal climatological conditions by entering a resistant resting stage called diapause, and it is essential that this strategy remains optimally timed with seasonal change. Climate change therefore exerts selection press... | | Maternal effects, Meta-analyses, Phenotypic plasticity, Terrestrial ecology | Bastien Castagneyrol | 2019-09-20 11:47:47 | ||
03 Feb 2023
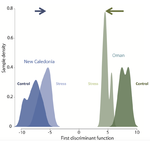
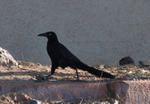
The role of climate change and niche shifts in divergent range dynamics of a sister-species pairDrivers of range expansion in a pair of sister grackle speciesRecommended by Esther Sebastián González based on reviews by 2 anonymous reviewers
The spatial distribution of a species is driven by both biotic and abiotic factors that may change over time (Soberón & Nakamura, 2009; Paquette & Hargreaves, 2021). Therefore, species ranges are dynamic, especially in humanized landscapes where changes occur at high speeds (Sirén & Morelli, 2020). The distribution of many species is being reduced because of human impacts; however, some species are expanding their distributions, even over their niche (Lustenhouwer & Parker, 2022). One of the factors that may lead to a geographic niche expansion is behavioral flexibility (Mikhalevich et al., 2017), but the mechanisms determining range expansion through behavioral changes are not fully understood. The PCI Ecology study by Summers et al. (2023) uses a very large database on the current and historic distribution of two species of grackles that have shown different trends in their distribution. The great-tailed grackle has largely expanded its range over the 20th century, while the range of the boat-tailed grackle has remained very similar. They take advantage of this differential response in the distribution of the two species and run several analyses to test whether it was a change in habitat availability, in the realized niche, in habitat connectivity or in in the other traits or conditions that previously limited the species range, what is driving the observed distribution of the species. The study finds a change in the niche of great-tailed grackle, consistent with the high behavioral flexibility of the species. The two reviewers and I have seen a lot of value in this study because 1) it addresses a very timely question, especially in the current changing world; 2) it is a first step to better understanding if behavioral attributes may affect species’ ability to change their niche; 3) it contrasts the results using several complementary statistical analyses, reinforcing their conclusions; 4) it is based on the preregistration Logan et al (2021), and any deviations from it are carefully explained and justified in the text and 5) the limitations of the study have been carefully discussed. It remains to know if the boat-tailed grackle has more limited behavioral flexibility than the great-tailed grackle, further confirming the results of this study. Logan CJ, McCune KB, Chen N, Lukas D (2021) Implementing a rapid geographic range expansion - the role of behavior and habitat changes. http://corinalogan.com/Preregistrations/gxpopbehaviorhabitat.html Lustenhouwer N, Parker IM (2022) Beyond tracking climate: Niche shifts during native range expansion and their implications for novel invasions. Journal of Biogeography, 49, 1481–1493. https://doi.org/10.1111/jbi.14395 Mikhalevich I, Powell R, Logan C (2017) Is behavioural flexibility evidence of cognitive complexity? How evolution can inform comparative cognition. Interface Focus, 7, 20160121. https://doi.org/10.1098/rsfs.2016.0121 Paquette A, Hargreaves AL (2021) Biotic interactions are more often important at species’ warm versus cool range edges. Ecology Letters, 24, 2427–2438. https://doi.org/10.1111/ele.13864 Sirén APK, Morelli TL (2020) Interactive range-limit theory (iRLT): An extension for predicting range shifts. Journal of Animal Ecology, 89, 940–954. https://doi.org/10.1111/1365-2656.13150 Soberón J, Nakamura M (2009) Niches and distributional areas: Concepts, methods, and assumptions. Proceedings of the National Academy of Sciences, 106, 19644–19650. https://doi.org/10.1073/pnas.0901637106 Summers JT, Lukas D, Logan CJ, Chen N (2022) The role of climate change and niche shifts in divergent range dynamics of a sister-species pair. EcoEvoRxiv, ver. 3 peer-reviewed and recommended by Peer Community in Ecology. https://doi.org/10.32942/osf.io/879pe | The role of climate change and niche shifts in divergent range dynamics of a sister-species pair | Jeremy Summers, Dieter Lukas, Corina J. Logan, Nancy Chen | <p>---This is a POST-STUDY manuscript for the PREREGISTRATION, which received in principle acceptance in 2020 from Dr. Sebastián González (reviewed by Caroline Nieberding, Tim Parker, and Pizza Ka Yee Chow; <a href="https://doi.org/10.24072/pci.ec... | | Behaviour & Ethology, Biogeography, Dispersal & Migration, Human impact, Landscape ecology, Preregistrations, Species distributions | Esther Sebastián González | 2022-05-26 20:07:33 | ||
21 Nov 2023
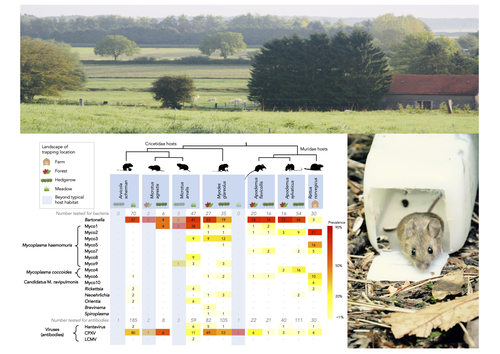
Pathogen community composition and co-infection patterns in a wild community of rodentsReservoirs of pestilence: what pathogen and rodent community analyses can tell us about transmission riskRecommended by Francois Massol based on reviews by Adrian Diaz, Romain Pigeault and 1 anonymous reviewer
Rodents are well known as one of the main animal groups responsible for human-transmitted pathogens. As such, it seems logical to try and survey what kinds of pathogenic microbes might be harboured by wild rodents, in order to establish some baseline surveillance and prevent future zoonotic outbreaks (Bernstein et al., 2022). This is exactly what Abbate et al. (2023) endeavoured and their findings are intimidating. Based on quite a large sampling effort, they collected more than 700 rodents of seven species around two villages in northeastern France. They looked for molecular markers indicative of viral and bacterial infections and proceeded to analyze their pathogen communities using multivariate techniques. Variation in the prevalence of the different pathogens was found among host species, with e.g. signs of CPXV more prevalent in Cricetidae while some Mycoplasma strains were more prevalent in Muridae. Co-circulation of pathogens was found in all species, with some evidencing signs of up to 12 different pathogen taxa. The diversity of co-circulating pathogens was markedly different between host species and higher in adult hosts, but not affected by sex. The dataset also evinced some slight differences between habitats, with meadows harbouring a little more diversity of rodent pathogens than forests. Less intuitively, some pathogen associations seemed quite repeatable, such as the positive association of Bartonella spp. with CPXV in the montane water vole. The study allowed the authors to test several associations already described in the literature, including associations between different hemotropic Mycoplasma species. I strongly invite colleagues interested in zoonoses, emerging pandemics and more generally One Health to read the paper of Abbate et al. (2023) and try to replicate them across the world. To prevent the next sanitary crises, monitoring rodents, and more generally vertebrates, population demographics is a necessary and enlightening step (Johnson et al., 2020), but insufficient. Following the lead of colleagues working on rodent ectoparasites (Krasnov et al., 2014), we need more surveys like the one described by Abbate et al. (2023) to understand the importance of the dilution effect in the prevalence and transmission of microbial pathogens (Andreazzi et al., 2023) and the formation of epidemics. We also need other similar studies to assess the potential of different rodent species to carry pathogens more or less capable of infecting other mammalian species (Morand et al., 2015), in other places in the world. References Abbate, J. L., Galan, M., Razzauti, M., Sironen, T., Voutilainen, L., Henttonen, H., Gasqui, P., Cosson, J.-F. & Charbonnel, N. (2023) Pathogen community composition and co-infection patterns in a wild community of rodents. BioRxiv, ver.4 peer-reviewed and recommended by Peer Community in Ecology. https://doi.org/10.1101/2020.02.09.940494 Andreazzi, C. S., Martinez-Vaquero, L. A., Winck, G. R., Cardoso, T. S., Teixeira, B. R., Xavier, S. C. C., Gentile, R., Jansen, A. M. & D'Andrea, P. S. (2023) Vegetation cover and biodiversity reduce parasite infection in wild hosts across ecological levels and scales. Ecography, 2023, e06579. | Pathogen community composition and co-infection patterns in a wild community of rodents | Jessica Lee Abbate, Maxime Galan, Maria Razzauti, Tarja Sironen, Liina Voutilainen, Heikki Henttonen, Patrick Gasqui, Jean-François Cosson, Nathalie Charbonnel | <p style="text-align: justify;">Rodents are major reservoirs of pathogens that can cause disease in humans and livestock. It is therefore important to know what pathogens naturally circulate in rodent populations, and to understand the factors tha... | | Biodiversity, Coexistence, Community ecology, Eco-immunology & Immunity, Epidemiology, Host-parasite interactions, Population ecology, Species distributions | Francois Massol | 2020-02-11 12:42:28 | ||
28 Apr 2023
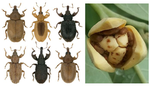
Most diverse, most neglected: weevils (Coleoptera: Curculionoidea) are ubiquitous specialized brood-site pollinators of tropical floraPollination-herbivory by weevils claiming for recognition: the Cinderella among pollinatorsRecommended by Juan Arroyo based on reviews by Susan Kirmse, Carlos Eduardo Nunes and 2 anonymous reviewersSince Charles Darwin times, and probably earlier, naturalists have been eager to report the rarest pollinators being discovered, and this still happens even in recent times; e.g., increased evidence of lizards, cockroaches, crickets or earwigs as pollinators (Suetsugu 2018, Komamura et al. 2021, de Oliveira-Nogueira et al. 2023), shifts to invasive animals as pollinators, including passerine birds and rats (Pattemore & Wilcove 2012), new amazing cases of mimicry in pollination, such as “bleeding” flowers that mimic wounded insects (Heiduk et al., 2023) or even the possibility that a tree frog is reported for the first time as a pollinator (de Oliveira-Nogueira et al. 2023). This is in part due to a natural curiosity of humans about rarity, which pervades into scientific insight (Gaston 1994). Among pollinators, the apparent rarity of some interaction types is sometimes a symptom of a lack of enough inquiry. This seems to be the case of weevil pollination, given that these insects are widely recognized as herbivores, particularly those that use plant parts to nurse their breed and never were thought they could act also as mutualists, pollinating the species they infest. This is known as a case of brood site pollination mutualism (BSPM), which also involves an antagonistic counterpart (herbivory) to which plants should face. This is the focus of the manuscript (Haran et al. 2023) we are recommending here. There is wide treatment of this kind of pollination in textbooks, albeit focused on yucca-yucca moth and fig-fig wasp interactions due to their extreme specialization (Pellmyr 2003, Kjellberg et al. 2005), and more recently accompanied by Caryophyllaceae-moth relationship (Kephart et al. 2006). Here we find a detailed review that shows that the most diverse BSPM, in terms of number of plant and pollinator species involved, is that of weevils in the tropics. The mechanism of BSPM does not involve a unique morphological syndrome, as it is mostly functional and thus highly dependent on insect biology (Fenster & al. 2004), whereas the flower phenotypes are highly divergent among species. Probably, the inconspicuous nature of the interaction, and the overwhelming role of weevils as seed predators, even as pests, are among the causes of the neglection of weevils as pollinators, as it could be in part the case of ants as pollinators (de Vega et al. 2014). The paper by Haran et al (2023) comes to break this point. Thus, the rarity of weevil pollination in former reports is not a consequence of an anecdotical nature of this interaction, even for the BSPM, according to the number of cases the authors are reporting, both in terms of plant and pollinator species involved. This review has a classical narrative format which involves a long text describing the natural history behind the cases. It is timely and fills the gap for this important pollination interaction for biodiversity and also for economic implications for fruit production of some crops. Former reviews have addressed related topics on BSPM but focused on other pollinators, such as those mentioned above. Besides, the review put much effort into the animal side of the interaction, which is not common in the pollination literature. Admittedly, the authors focus on the detailed description of some paradigmatic cases, and thereafter suggest that these can be more frequently reported in the future, based on varied evidence from morphology, natural history, ecology, and distribution of alleged partners. This procedure was common during the development of anthecology, an almost missing term for floral ecology (Baker 1983), relying on accumulative evidence based on detailed observations and experiments on flowers and pollinators. Currently, a quantitative approach based on the tools of macroecological/macroevolutionary analyses is more frequent in reviews. However, this approach requires a high amount of information on the natural history of the partnership, which allows for sound hypothesis testing. By accumulating this information, this approach allows the authors to pose specific questions and hypotheses which can be tested, particularly on the efficiency of the systems and their specialization degree for both the plants and the weevils, apparently higher for the latter. This will guarantee that this paper will be frequently cited by floral ecologists and evolutionary biologists and be included among the plethora of floral syndromes already described, currently based on more explicit functional grounds (Fenster et al. 2004). In part, this is one of the reasons why the sections focused on future prospects is so large in the review. I foresee that this mutualistic/antagonistic relationship will provide excellent study cases for the relative weight of these contrary interactions among the same partners and its relationship with pollination specialization-generalization and patterns of diversification in the plants and/or the weevils. As new studies are coming, it is possible that BSPM by weevils appears more common in non-tropical biogeographical regions. In fact, other BSPM are not so uncommon in other regions (Prieto-Benítez et al. 2017). In the future, it would be desirable an appropriate testing of the actual effect of phylogenetic niche conservatism, using well known and appropriately selected BSPM cases and robust phylogenies of both partners in the mutualism. Phylogenetic niche conservatism is a central assumption by the authors to report as many cases as possible in their review, and for that they used taxonomic relatedness. As sequence data and derived phylogenies for large numbers of vascular plant species are becoming more frequent (Jin & Quian 2022), I would recommend the authors to perform a comparative analysis using this phylogenetic information. At least, they have included information on phylogenetic relatedness of weevils involved in BSPM which allow some inferences on the multiple origins of this interaction. This is a good start to explore the drivers of these multiple origins through the lens of comparative biology. References Baker HG (1983) An Outline of the History of Anthecology, or Pollination Biology. In: L Real (ed). Pollination Biology. Academic Press. de-Oliveira-Nogueira CH, Souza UF, Machado TM, Figueiredo-de-Andrade CA, Mónico AT, Sazima I, Sazima M, Toledo LF (2023). Between fruits, flowers and nectar: The extraordinary diet of the frog Xenohyla truncate. Food Webs 35: e00281. https://doi.org/10.1016/j.fooweb.2023.e00281 Fenster CB W, Armbruster S, Wilson P, Dudash MR, Thomson JD (2004). Pollination syndromes and floral specialization. Annu. Rev. Ecol. Evol. Syst. 35: 375–403. https://doi.org/10.1146/annurev.ecolsys.34.011802.132347 Gaston KJ (1994). What is rarity? In KJ Gaston (ed): Rarity. Population and Community Biology Series, vol 13. Springer, Dordrecht. https://doi.org/10.1007/978-94-011-0701-3_1 Haran J, Kergoat GJ, Bruno, de Medeiros AS (2023) Most diverse, most neglected: weevils (Coleoptera: Curculionoidea) are ubiquitous specialized brood-site pollinators of tropical flora. hal. 03780127, version 2 peer-reviewed and recommended by Peer Community in Ecology. https://hal.inrae.fr/hal-03780127 Heiduk A, Brake I, Shuttleworth A, Johnson SD (2023) ‘Bleeding’ flowers of Ceropegia gerrardii (Apocynaceae-Asclepiadoideae) mimic wounded insects to attract kleptoparasitic fly pollinators. New Phytologist. https://doi.org/10.1111/nph.18888 Jin, Y., & Qian, H. (2022). V. PhyloMaker2: An updated and enlarged R package that can generate very large phylogenies for vascular plants. Plant Diversity, 44(4), 335-339. https://doi.org/10.1016/j.pld.2022.05.005 Kjellberg F, Jousselin E, Hossaert-Mckey M, Rasplus JY (2005). Biology, ecology, and evolution of fig-pollinating wasps (Chalcidoidea, Agaonidae). In: A. Raman et al (eds) Biology, ecology and evolution of gall-inducing arthropods 2, 539-572. Science Publishers, Enfield. Komamura R, Koyama K, Yamauchi T, Konno Y, Gu L (2021). Pollination contribution differs among insects visiting Cardiocrinum cordatum flowers. Forests 12: 452. https://doi.org/10.3390/f12040452 Pattemore DE, Wilcove DS (2012) Invasive rats and recent colonist birds partially compensate for the loss of endemic New Zealand pollinators. Proc. R. Soc. B 279: 1597–1605. https://doi.org/10.1098/rspb.2011.2036 Pellmyr O (2003) Yuccas, yucca moths, and coevolution: a review. Ann. Missouri Bot. Gard. 90: 35-55. https://doi.org/10.2307/3298524 Prieto-Benítez S, Yela JL, Giménez-Benavides L (2017) Ten years of progress in the study of Hadena-Caryophyllaceae nursery pollination. A review in light of new Mediterranean data. Flora, 232, 63-72. https://doi.org/10.1016/j.flora.2017.02.004 Suetsugu K (2019) Social wasps, crickets and cockroaches contribute to pollination of the holoparasitic plant Mitrastemon yamamotoi (Mitrastemonaceae) in southern Japan. Plant Biology 21 176–182. https://doi.org/10.1111/plb.12889 | Most diverse, most neglected: weevils (Coleoptera: Curculionoidea) are ubiquitous specialized brood-site pollinators of tropical flora | Julien Haran, Gael J. Kergoat, Bruno A. S. de Medeiros | <p style="text-align: justify;">In tropical environments, and especially tropical rainforests, a major part of pollination services is provided by diverse insect lineages. Unbeknownst to most, beetles, and more specifically hyperdiverse weevils (C... | | Biodiversity, Evolutionary ecology, Pollination, Tropical ecology | Juan Arroyo | 2022-09-28 11:54:37 | ||
15 Nov 2023

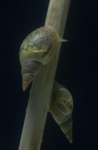
The challenges of independence: ontogeny of at-sea behaviour in a long-lived seabirdOn the road to adulthood: exploring progressive changes in foraging behaviour during post-fledging immaturity using remote trackingRecommended by Blandine Doligez based on reviews by Juliet Lamb and 1 anonymous reviewerIn most vertebrate species, the period of life spanning from departure from the growing site until reaching a more advanced life stage (immature or adult) is critical. During this period, juveniles are often highly vulnerable because they have not reached the morphological, physiological and behavioural maturity levels of adults yet and are therefore at high risk of mortality, e.g. through starvation, depredation or competition (e.g. Marchetti & Price 1989, Wunderle 1991, Naef-Daenzer & Grüebler 2016). In line with this, juvenile survival is most often far lower than adult survival (e.g. Wooller et al. 1992). In species with parental care, juveniles have to acquire behavioural independence from their parents and possibly establish their own territory during this period of life. Very often, this is also the period that is least well-known in the life cycle (Cox et al. 2014, Naef-Daenzer & Grüebler 2016) because of reduced accessibility to individuals and/or adoption of low conspicuous behaviours. Therefore, our understanding of how juveniles acquire typical adult behaviours and how this progressively increases their survival prospects is still very limited (Naef-Daenzer & Grüebler 2016), and questions such as the length of this transition period or the cognitive (e.g. learning, memorization) mechanisms involved remain largely unresolved. This is particularly true regarding the acquisition of independent foraging behaviour (Marchetti & Price 1989). Because direct observations of juvenile behaviours are usually very difficult except in specific situations or at the cost of an enormous effort, the use of remote tracking devices can be particularly appealing in this context (e.g. Ponchon et al. 2013, Kays et al. 2015). Over the past decades, technical advances have allowed the monitoring of not only individuals’ movements at both large and small spatial scales but also their activities and behaviours based on different parameters recording e.g. speed of movement or diving depth (Whitford & Klimley 2019). Device miniaturization has in particular allowed smaller species to be equipped and/or longer periods of time to be monitored (e.g. Naef-Daenzer et al. 2005). This has opened up whole fields of research, and has been particularly used on marine seabirds. In these species, individuals are most often inaccessible when at sea, representing most of the time outside (and even within) the breeding season, and the life cycle of these long-lived species can include an extended immature period (up to many years) during which most of them will remain unseen, until they come back as breeders or pre-breeders (e.g. Wooller et al. 1992, Oro & Martínez-Abraín 2009). Survival has been found to increase gradually with age in these species before reaching high values characteristic of the adult stage. However, the mechanisms underlying this increase are still to be deciphered. The study by Delord et al. (2023) builds upon the hypothesis that juveniles gradually learn foraging techniques and movement strategies, improving their foraging efficiency, as previous data on flight parameters seemed to show in different long-lived bird species. Yet, these previous studies obtained data over a limited period of time, i.e. a few months at best. Whether these data could capture the whole dynamics of the progressive acquisition of foraging and movement skills can only be assessed by measuring behaviour over a longer time period and comparing it to similar data in adults, to account for seasonal variation in relation to both resource availability and energetic demands, e.g. due to molt. The present study (Delord et al. 2023) addresses these questions by taking advantage of longer-lasting recordings of the location and activity of juvenile, immature and adult birds obtained simultaneously to investigate changes over time in juvenile behaviour and thereby provide hints about how young progressively acquire foraging skills. This study is performed on Amsterdam albatrosses, a highly endangered long-lived sea bird, with obvious conservation issues (Thiebot et al. 2015). The results show progressive changes in foraging effort over the first two months after departure from the birth colony, but large differences remain between life stages over a much longer time frame. They also reveal strong variations between sexes and over time in the year. Overall, this study, therefore, confirms the need for very long-term data to be collected in order to address the question of progressive behavioural maturation and associated survival consequences in such species with strongly deferred maturity. Ideally, the same individuals should be monitored over different life stages, from the juvenile period up to adulthood, but this would require further technical development to release the issue of powering duration limitation. As reviewers emphasized in the first review round, one main challenge now remains to ascertain the outcome of the observed behavioural changes in foraging behaviour: we expect them to reflect improvement in foraging skills and thus performance of juveniles over time, but this would need to be tested. Collecting data on foraging efficiency is yet another challenge, that future technical developments may also help overcome. Importantly also, data were available only for individuals that could be caught again because the tracking device had to be retrieved from the bird. Here, a substantial fraction of the loggers (one-fifth) could not be found again (Delord et al. 2023). To what extent the birds for which no data could be obtained are a random sample of the equipped birds would also need to be assessed. The further development of remote tracking techniques allowing data to be downloaded from a long distance should help further exploration of behavioural ontogeny of juveniles while maturing and its survival consequences. Because the maturation process explored here is likely to show very different characteristics (e.g. timing and speed) in smaller / shorter-lived species (see Cox et al. 2014, Naef-Daenzer & Grüebler 2016), the development of miniaturization is also expected to allow further investigation of post-fledging behavioural maturation in a wider range of bird species. Our understanding of this crucial life phase in different types of species should thus continue to progress in the coming years. References Cox W. A., Thompson F. R. III, Cox A. S. & Faaborg J. 2014. Post-fledging survival in passerine birds and the value of post-fledging studies to conservation. Journal of Wildlife Management, 78: 183-193. https://doi.org/10.1002/jwmg.670 Delord K., Weimerskirch H. & Barbraud C. 2023. The challenges of independence: ontogeny of at-sea behaviour in a long-lived seabird. bioRxiv, ver. 6 peer-reviewed and recommended by Peer Community in Ecology. https://doi.org/10.1101/2021.10.23.465439 Kays R., Crofoot M. C., Jetz W. & Wikelski M. 2015. Terrestrial animal tracking as an eye on life and planet. Science, 348 (6240). https://doi.org/10.1126/science.aaa2478 Marchetti K: & Price T. 1989. Differences in the foraging of juvenile and adult birds: the importance of developmental constraints. Biological Reviews, 64: 51-70. https://doi.org/10.1111/j.1469-185X.1989.tb00638.x Naef-Daenzer B., Fruh D., Stalder M., Wetli P. & Weise E. 2005. Miniaturization (0.2 g) and evaluation of attachment techniques of telemetry transmitters. The Journal of Experimental Biology, 208: 4063–4068. https://doi.org/10.1242/jeb.01870 Naef-Daenzer B. & Grüebler M. U. 2016. Post-fledging survival of altricial birds: ecological determinants and adaptation. Journal of Field Ornithology, 87: 227-250. https://doi.org/10.1111/jofo.12157 Oro D. & Martínez-Abraín A. 2009. Ecology and behavior of seabirds. Marine Ecology, pp.364-389. Ponchon A., Grémillet D., Doligez B., Chambert T., Tveera T., Gonzàles-Solìs J & Boulinier T. 2013. Tracking prospecting movements involved in breeding habitat selection: insights, pitfalls and perspectives. Methods in Ecology and Evolution, 4: 143-150. https://doi.org/10.1111/j.2041-210x.2012.00259.x Thiebot J.-B., Delord K., Barbraud C., Marteau C. & Weimerskirch H. 2015. 167 individuals versus millions of hooks: bycatch mitigation in longline fisheries underlies conservation of Amsterdam albatrosses. Aquatic Conservation 26: 674-688. https://doi.org/10.1002/aqc.2578 Whitford M & Klimley A. P. An overview of behavioral, physiological, and environmental sensors used in animal biotelemetry and biologging studies. Animal Biotelemetry, 7: 26. https://doi.org/10.1186/s40317-019-0189-z Wooller R.D., Bradley J. S. & Croxall J. P. 1992. Long-term population studies of seabirds. Trends in Ecology and Evolution, 7: 111-114. https://doi.org/10.1016/0169-5347(92)90143-y Wunderle J. M. 1991. Age-specific foraging proficiency in birds. Current Ornithology, 8: 273-324. | The challenges of independence: ontogeny of at-sea behaviour in a long-lived seabird | Karine Delord, Henri Weimerskirch, Christophe Barbraud | <p style="text-align: justify;">The transition to independent foraging represents an important developmental stage in the life cycle of most vertebrate animals. Juveniles differ from adults in various life history traits and tend to survive less w... | | Behaviour & Ethology, Foraging, Ontogeny | Blandine Doligez | 2021-10-26 07:51:49 | ||
28 Mar 2019
Direct and transgenerational effects of an experimental heat wave on early life stages in a freshwater snailEscargots cooked just right: telling apart the direct and indirect effects of heat waves in freashwater snailsRecommended by vincent calcagno based on reviews by Amanda Lynn Caskenette, Kévin Tougeron and arnaud sentisAmongst the many challenges and forms of environmental change that organisms face in our era of global change, climate change is perhaps one of the most straightforward and amenable to investigation. First, measurements of day-to-day temperatures are relatively feasible and accessible, and predictions regarding the expected trends in Earth surface temperature are probably some of the most reliable we have. It appears quite clear, in particular, that beyond the overall increase in average temperature, the heat waves locally experienced by organisms in their natural habitats are bound to become more frequent, more intense, and more long-lasting [1]. Second, it is well appreciated that temperature is a major environmental factor with strong impacts on different facets of organismal development and life-history [2-4]. These impacts have reasonably clear mechanistic underpinnings, with definite connections to biochemistry, physiology, and considerations on energetics. Third, since variation in temperature is a challenge already experienced by natural populations across their current and historical ranges, it is not a completely alien form of environmental change. Therefore, we already learnt quite a lot about it in several species, and so did the species, as they may be expected to have evolved dedicated adaptive mechanisms to respond to elevated temperatures. Last, but not least, temperature is quite amenable to being manipulated as an experimental factor. References [1] Meehl, G. A., & Tebaldi, C. (2004). More intense, more frequent, and longer lasting heat waves in the 21st century. Science (New York, N.Y.), 305(5686), 994–997. doi: 10.1126/science.1098704 | Direct and transgenerational effects of an experimental heat wave on early life stages in a freshwater snail | Katja Leicht, Otto Seppälä | <p>Global climate change imposes a serious threat to natural populations of many species. Estimates of the effects of climate change‐mediated environmental stresses are, however, often based only on their direct effects on organisms, and neglect t... | | Climate change | vincent calcagno | 2018-10-22 22:19:22 | ||
04 Sep 2019
Gene expression plasticity and frontloading promote thermotolerance in Pocillopora coralsTranscriptomics of thermal stress response in coralsRecommended by Staffan Jacob based on reviews by Mar SobralClimate change presents a challenge to many life forms and the resulting loss of biodiversity will critically depend on the ability of organisms to timely respond to a changing environment. Shifts in ecological parameters have repeatedly been attributed to global warming, with the effectiveness of these responses varying among species [1, 2]. Organisms do not only have to face a global increase in mean temperatures, but a complex interplay with another crucial but largely understudied aspect of climate change: thermal fluctuations. Understanding the mechanisms underlying adaptation to thermal fluctuations is thus a timely and critical challenge. References [1] Parmesan, C., & Yohe, G. (2003). A globally coherent fingerprint of climate change impacts across natural systems. Nature, 421(6918), 37–42. doi: 10.1038/nature01286 | Gene expression plasticity and frontloading promote thermotolerance in Pocillopora corals | K. Brener-Raffalli, J. Vidal-Dupiol, M. Adjeroud, O. Rey, P. Romans, F. Bonhomme, M. Pratlong, A. Haguenauer, R. Pillot, L. Feuillassier, M. Claereboudt, H. Magalon, P. Gélin, P. Pontarotti, D. Aurelle, G. Mitta, E. Toulza | <p>Ecosystems worldwide are suffering from climate change. Coral reef ecosystems are globally threatened by increasing sea surface temperatures. However, gene expression plasticity provides the potential for organisms to respond rapidly and effect... | | Climate change, Evolutionary ecology, Marine ecology, Molecular ecology, Phenotypic plasticity, Symbiosis | Staffan Jacob | 2018-08-29 10:46:55 | ||
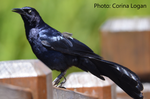
06 Oct 2020
Does space use behavior relate to exploration in a species that is rapidly expanding its geographic range?Explore and move: a key to success in a changing world?Recommended by Blandine Doligez based on reviews by Joe Nocera, Marion Nicolaus and Laure CauchardChanges in the spatial range of many species are one of the major consequences of the profound alteration of environmental conditions due to human activities. Some species expand, sometimes spectacularly during invasions; others decline; some shift. Because these changes result in local biodiversity loss (whether local species go extinct or are replaced by colonizing ones), understanding the factors driving spatial range dynamics appears crucial to predict biodiversity dynamics. Identifying the factors that shape individual movement is a main step towards such understanding. The study described in this preregistration (McCune et al. 2020) falls within this context by testing possible links between individual exploration behaviour and movements related to daily space use in an avian study model currently rapidly expanding, the great-tailed grackle (Quiscalus mexicanus). Movement and exploration: which direction(s) for the link between exploration and dispersal? Evolutionary and conservation perspectives References Badayev, A. V., Martin, T. E and Etges, W. J. 1996. Habitat sampling and habitat selection by female wild turkeys: ecological correlates and reproductive consequences. Auk 113: 636-646. doi: https://doi.org/10.2307/4088984 | Does space use behavior relate to exploration in a species that is rapidly expanding its geographic range? | Kelsey B. McCune, Cody Ross, Melissa Folsom, Luisa Bergeron, Corina Logan | Great-tailed grackles (Quiscalus mexicanus) are rapidly expanding their geographic range (Wehtje 2003). Range expansion could be facilitated by consistent behavioural differences between individuals on the range edge and those in other parts of th... | | Behaviour & Ethology, Biological invasions, Conservation biology, Habitat selection, Phenotypic plasticity, Preregistrations, Spatial ecology, Metacommunities & Metapopulations | Blandine Doligez | 2019-09-30 19:27:40 |


