
Direct submissions to PCI Ecology from bioRxiv.org are possible using the B2J service
Latest recommendations

| Id | Title * | Authors * ▲ | Abstract * | Picture * | Thematic fields * | Recommender | Reviewers | Submission date | |
|---|---|---|---|---|---|---|---|---|---|
03 Jan 2024
Efficient sampling designs to assess biodiversity spatial autocorrelation : should we go fractal?Spatial patterns and autocorrelation challenges in ecological conservationRecommended by Eric Goberville based on reviews by Nigel Yoccoz and Charles J Marsh based on reviews by Nigel Yoccoz and Charles J Marsh
“Pattern, like beauty, is to some extent in the eye of the beholder” (Grant 1977 in Wiens, 1989) Ecologists are immersed in unraveling the complex spatial patterns that govern species diversity, driven by both practical and theoretical imperatives (Rahbek, 2005; Wang et al., 2019). This dual focus necessitates a practical imperative for strategic biodiversity conservation, requiring a nuanced understanding of locations with peak species richness and dynamic shifts in species assemblages (Chase et al., 2020). Simultaneously, there is a theoretical interest in using diversity patterns as empirical testing grounds for theories explaining factors influencing diversity disparities and the associated increase in species turnover correlated with inter-site distance (Condit et al., 2002).
McGill (2010), in his paper "Matters of Scale", highlights the scale-dependent nature of ecology, aligning with the recognition that spatial autocorrelation is inherent in biogeographical data and often correlated with sample size (Rahbek, 2005). Spatial autocorrelation, often underestimated in ecological studies (Dormann, 2007), occurs when proximate locations exhibit similarities in ecological attributes (Tobler, 1970; Getis, 2010), introducing a latent bias that compromises the robustness of ecological findings (Dormann, 2007; Dormann et al., 2007). This phenomenon serves as both an asset, providing valuable information for inferring processes from patterns (Palma et al. 1999), and a challenge, imposing limitations on hypothesis testing and prediction (Dormann et al., 2007 and references therein). Various factors contribute to spatial autocorrelation, with three primary contributors (Dormann et al., 2007; Legendre, 1993; Legendre and Fortin, 1989; Legendre and Legendre, 2012): (i) distance-related effects in biological processes, (ii) misrepresentation of non-linear relationships between the environment and species as linear and (iii) the oversight of a crucial spatially structured environmental determinant in the statistical model, leading to spatial structuring in the response (Dormann et al., 2007).
Recognising the pivotal role of spatial heterogeneity in ecological theories (Wang et al., 2019), it becomes imperative to discern and address the limitations introduced by spatial autocorrelation (Legendre, 1993). McGill (2011) emphasises that the ultimate goal of biodiversity pattern studies should be to develop a quantitative predictive theory useful for conservation. The spatial dimension's importance in study planning, determining the system's scale, appropriate quadrat size, and spacing between sampling stations, is paramount (Fortin, 1999a,b). Responses to these considerations are intricately linked with study objectives and insights from pre-sampling campaigns, underscoring the need for a nuanced and rigorous approach (Delmelle, 2021).
Understanding statistical techniques and nested sampling designs is crucial to answering fundamental ecological questions (Dormann et al., 2007; McDonald, 2012). In addressing spatial autocorrelation challenges, ecologists must recognize the limitations of many standard statistical methods in ecological studies (Dale and Fortin, 2002; Legendre and Fortin, 1989; Steel et al., 2013). In the initial phases of description or hypothesis generation, ecologists should proactively acknowledge the spatial structure in their data and conduct tests for spatial autocorrelation (for a comprehensive description, see Legendre and Fortin, 1989): various tools, including correlograms, spectral analysis, the Mantel test, and clustering methods, facilitate the assessment and description of spatial structures. The partial Mantel test enables the study of causal models with space as an explanatory variable. Techniques for mapping ecological variables, such as interpolation, trend surface analysis, and constrained clustering, yield maps providing valuable insights into the spatial dynamics of ecological systems.
This refined consideration of spatial autocorrelation emerges as an imperative in ecological research, fostering a deeper and more precise understanding of the intricate interplay between species diversity, spatial patterns, and the inherent limitations imposed by spatial autocorrelation (Legendre et al., 2002). This not only contributes significantly to the scientific discourse in ecology but also aligns with McGill's vision of developing predictive theories for effective conservation (Bacaro et al., 2016; McGill, 2011).
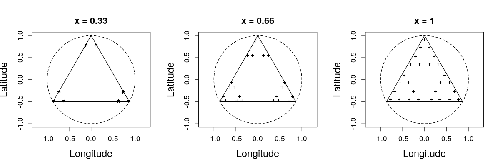
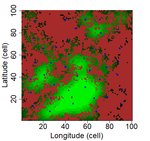
In this study by Fabien Laroche (2023), titled “Efficient sampling designs to assess biodiversity spatial autocorrelation: should we go fractal?” the primary focus was on addressing the challenges associated with estimating the autocorrelation range of species distribution across spatial scales. The study aimed to explore alternative sampling designs, with a particular focus on the application of fractal designs—self-similar designs with well-identified scales. The overarching goal was to evaluate whether fractal designs could offer a more efficient compromise compared to traditional hybrid designs, which involve mixing random sampling points with a systematic grid.
Virtual ecology provides a way to test whether sampling designs can accurately detect or quantify effects of interest before implementing them in the field. Beyond the question of assessing the power of empirical designs, a virtual ecology analysis contributes to clearly formulating the set of questions associated with a design. However, only a few virtual studies have focused on efficient designs to accurately estimate the autocorrelation range of biodiversity variables. In this study, the statistical framework of optimal design of experiments was employed—a methodology often used in building and comparing designs of temporal or spatiotemporal biodiversity surveys but rarely applied to the specific problem of quantifying spatial autocorrelation.
Key findings from the study shed light on optimal sampling strategies, with a notable dependence on the feasible grid mesh size over the study area in relation to expected autocorrelation range values. The results demonstrated that the efficiency of designs varied based on the specific effect under study. Fractal designs, however, exhibited superior performance, particularly when assessing the effect of a monotonic environmental gradient across space.
In conclusion, the study provides valuable insights into the potential benefits of incorporating fractal designs in biodiversity studies, offering a nuanced and efficient approach to estimate spatial autocorrelation. These findings contribute significantly to the ongoing scientific discourse in ecology, providing practical considerations for improving sampling designs in biodiversity assessments.
References
Bacaro, G., Altobelli, A., Cameletti, M., Ciccarelli, D., Martellos, S., Palmer, M.W., Ricotta, C., Rocchini, D., Scheiner, S.M., Tordoni, E., Chiarucci, A., 2016. Incorporating spatial autocorrelation in rarefaction methods: Implications for ecologists and conservation biologists. Ecological Indicators 69, 233-238. https://doi.org/10.1016/j.ecolind.2016.04.026
Chase, J.M., Jeliazkov, A., Ladouceur, E., Viana, D.S., 2020. Biodiversity conservation through the lens of metacommunity ecology. Annals of the New York Academy of Sciences 1469, 86-104. https://doi.org/10.1111/nyas.14378
Condit, R., Pitman, N., Leigh, E.G., Chave, J., Terborgh, J., Foster, R.B., Núñez, P., Aguilar, S., Valencia, R., Villa, G., Muller-Landau, H.C., Losos, E., Hubbell, S.P., 2002. Beta-Diversity in Tropical Forest Trees. Science 295, 666-669. https://doi.org/10.1126/science.1066854
Dale, M.R.T., Fortin, M.-J., 2002. Spatial autocorrelation and statistical tests in ecology. Écoscience 9, 162-167. https://doi.org/10.1080/11956860.2002.11682702
Delmelle, E.M., 2021. Spatial Sampling, in: Fischer, M.M., Nijkamp, P. (Eds.), Handbook of Regional Science. Springer Berlin Heidelberg, Berlin, Heidelberg, pp. 1829-1844.
Dormann, C.F., 2007. Effects of incorporating spatial autocorrelation into the analysis of species distribution data. Global Ecology & Biogeography 16, 129-128. https://doi.org/10.1111/j.1466-8238.2006.00279.x
Dormann, C.F., McPherson, J.M., Araújo, M.B., Bivand, R., Bolliger, J., Carl, G., Davies, R.G., Hirzel, A., Jetz, W., Kissling, W.D., Kühn, I., Ohlemüler, R., Peres-Neto, P.R., Reineking, B., Schröder, B., Schurr, F.M., Wilson, R., 2007. Methods to account for spatial autocorrelation in the analysis of species distributional data: a review. Ecography 33, 609-628. https://doi.org/10.1111/j.2007.0906-7590.05171.x
Fortin, M.-J., 1999a. Effects of quadrat size and data measurement on the detection of boundaries. Journal of Vegetation Science 10, 43-50. https://doi.org/10.2307/3237159
Fortin, M.-J., 1999b. Effects of sampling unit resolution on the estimation of spatial autocorrelation. Écoscience 6, 636-641. https://doi.org/10.1080/11956860.1999.11682547
Getis, A., 2010. Spatial Autocorrelation, in: Fischer, M.M., Getis, A. (Eds.), Handbook of Applied Spatial Analysis: Software Tools, Methods and Applications. Springer Berlin Heidelberg, Berlin, Heidelberg, pp. 255-278.
Laroche, F., 2023. Efficient sampling designs to assess biodiversity spatial autocorrelation: should we go fractal? bioRxiv, 2022.07.29.501974, ver. 4 peer-reviewed and recommended by Peer Community in Ecology. https://doi.org/10.1101/2022.07.29.501974
Legendre, P., 1993. Spatial Autocorrelation: Trouble or New Paradigm? Ecology 74, 1659-1673. https://doi.org/10.2307/1939924
Legendre, P., Dale, M.R.T., Fortin, M.-J., Gurevitch, J., Hohn, M., Myers, D., 2002. The consequences of spatial structure for the design and analysis of ecological field surveys. Ecography 25, 601-615. https://doi.org/10.1034/j.1600-0587.2002.250508.x
Legendre, P., Fortin, M.J., 1989. Spatial pattern and ecological analysis. Vegetatio 80, 107-138. https://doi.org/10.1007/BF00048036
Legendre, P., Legendre, L., 2012. Numerical Ecology, Third Edition ed. Elsevier, The Netherlands.
McDonald, T., 2012. Spatial sampling designs for long-term ecological monitoring, in: Cooper, A.B., Gitzen, R.A., Licht, D.S., Millspaugh, J.J. (Eds.), Design and Analysis of Long-term Ecological Monitoring Studies. Cambridge University Press, Cambridge, pp. 101-125.
McGill, B.J., 2010. Matters of Scale. Science 328, 575-576. https://doi.org/10.1126/science.1188528
McGill, B.J., 2011. Linking biodiversity patterns by autocorrelated random sampling. American Journal of Botany 98, 481-502. https://doi.org/10.3732/ajb.1000509
Rahbek, C., 2005. The role of spatial scale and the perception of large-scale species-richness patterns. Ecology Letters 8, 224-239. https://doi.org/10.1111/j.1461-0248.2004.00701.x
Steel, E.A., Kennedy, M.C., Cunningham, P.G., Stanovick, J.S., 2013. Applied statistics in ecology: common pitfalls and simple solutions. Ecosphere 4, art115. https://doi.org/10.1890/ES13-00160.1
Tobler, W.R., 1970. A Computer Movie Simulating Urban Growth in the Detroit Region. Economic Geography 46, 234-240. https://doi.org/10.2307/143141
Wang, S., Lamy, T., Hallett, L.M., Loreau, M., 2019. Stability and synchrony across ecological hierarchies in heterogeneous metacommunities: linking theory to data. Ecography 42, 1200-1211. https://doi.org/10.1111/ecog.04290
Wiens, J.A., 1989. The ecology of bird communities. Cambridge University Press.
| Efficient sampling designs to assess biodiversity spatial autocorrelation : should we go fractal? | Fabien Laroche | <p>Quantifying the autocorrelation range of species distribution in space is necessary for applied ecological questions, like implementing protected area networks or monitoring programs. However, the power of spatial sampling designs to estimate t... | | Biodiversity, Landscape ecology, Spatial ecology, Metacommunities & Metapopulations, Statistical ecology | Eric Goberville | 2023-04-21 10:54:29 | ||
19 Aug 2020
Three points of consideration before testing the effect of patch connectivity on local species richness: patch delineation, scaling and variability of metricsGood practice guidelines for testing species-isolation relationships in patch-matrix systemsRecommended by Damaris Zurell based on reviews by 3 anonymous reviewersConservation biology is strongly rooted in the theory of island biogeography (TIB). In island systems where the ocean constitutes the inhospitable matrix, TIB predicts that species richness increases with island size as extinction rates decrease with island area (the species-area relationship, SAR), and species richness increases with connectivity as colonisation rates decrease with island isolation (the species-isolation relationship, SIR)[1]. In conservation biology, patches of habitat (habitat islands) are often regarded as analogous to islands within an unsuitable matrix [2], and SAR and SIR concepts have received much attention as habitat loss and habitat fragmentation are increasingly threatening biodiversity [3,4]. References [1] MacArthur, R.H. and Wilson, E.O. (1967) The theory of island biogeography. Princeton University Press, Princeton. | Three points of consideration before testing the effect of patch connectivity on local species richness: patch delineation, scaling and variability of metrics | F. Laroche, M. Balbi, T. Grébert, F. Jabot & F. Archaux | <p>The Theory of Island Biogeography (TIB) promoted the idea that species richness within sites depends on site connectivity, i.e. its connection with surrounding potential sources of immigrants. TIB has been extended to a wide array of fragmented... | | Biodiversity, Community ecology, Dispersal & Migration, Landscape ecology, Spatial ecology, Metacommunities & Metapopulations | Damaris Zurell | 2019-05-20 16:03:47 | ||
23 Oct 2023
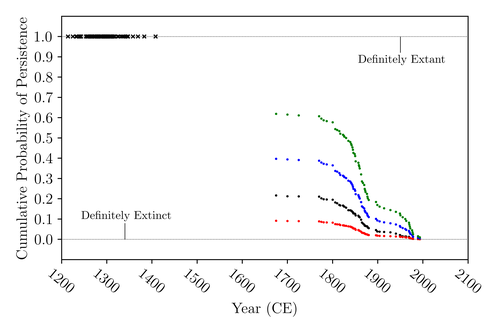
The Moa the Merrier: Resolving When the Dinornithiformes Went ExtinctAre Moas ancient Lazarus species?Recommended by Werner Ulrich based on reviews by Tim Coulson and Richard Holdaway
Ancient human colonisation often had catastrophic consequences for native fauna. The North American Megafauna went extinct shortly after humans entered the scene and Madagascar suffered twice, before 1500 CE and around 1700 CE after the Malayan and European colonisation. Maoris colonised New Zealand by about 1300 and a century later the giant Moa birds (Dinornithiformes) sharply declined. But did they went extinct or are they an ancient example of Lazarus species, species thought to be extinct but still alive? Scattered anecdotes of late sightings of living Moas even up to the 20th century seem to suggest the latter. The quest for later survival has also a criminal aspect. Who did it, the Maoris or the white colonisers in the late 18th century? The present work by Floe Foxon (2023) tries to settle this question. It uses a survival modelling approach and an assessment of the reliability of nearly 100 alleged sightings. The model favours the so-called overkill hypothesis, that Moas probably went extinct in the 15th century shortly after Maori colonisation. A small but still remarkable probability remained for survival up to 1770. Later sightings turned out to be highly unreliable. The paper is important as it does not rely on subjective discussions of late sightings but on a probabilistic modelling approach with sensitivity testing prior applied to marsupials. As common in probabilistic approaches, the study does not finally settle the case. A probability of as much as 20% remained for late survival after 1450 CE. This is not improbable as New Zealand was sufficiently unexplored in those days to harbour a few refuges for late survivors. However, in this respect, it is a bit unfortunate that at the end of the discussion, the paper cites Heuvelmans, the founder of cryptozoology, and it mentions the ivory-billed woodpecker, which has recently been redetected. No Moa remains were found after 1450. References Foxon F (2023) The Moa the Merrier: Resolving When the Dinornithiformes Went Extinct. bioRxiv, 2023.08.07.552261, ver. 2 peer-reviewed and recommended by Peer Community in Ecology. https://doi.org/10.1101/2023.08.07.552261 | The Moa the Merrier: Resolving When the Dinornithiformes Went Extinct | Floe Foxon | <p style="text-align: justify;">The Moa (Aves: Dinornithiformes) are an extinct group of the ratite clade from New Zealand. The overkill hypothesis asserts that the first New Zealand settlers hunted the Moa to extinction by 1450 CE, whereas the st... | | Conservation biology, Human impact, Statistical ecology, Zoology | Werner Ulrich | Tim Coulson, Richard Holdaway | 2023-08-08 17:14:30 | |
30 Sep 2020
How citizen science could improve Species Distribution Models and their independent assessmentCitizen science contributes to SDM validationRecommended by Francisco Lloret based on reviews by Maria Angeles Perez-Navarro and 1 anonymous reviewerCitizen science is becoming an important piece for the acquisition of scientific knowledge in the fields of natural sciences, and particularly in the inventory and monitoring of biodiversity (McKinley et al. 2017). The information generated with the collaboration of citizens has an evident importance in conservation, by providing information on the state of populations and habitats, helping in mitigation and restoration actions, and very importantly contributing to involve society in conservation (Brown and Williams 2019).
An obvious advantage of these initiatives is the ability to mobilize human resources on a large territorial scale and in the medium term, which would otherwise be difficult to finance. The resulting increasing information then can be processed with advanced computational techniques (Hochachka et al 2012; Kelling et al. 2015), thus improving our interpretation of the distribution of species. Specifically, the ability to obtain information on a large territorial scale can be integrated into studies based on Species Distribution Models SDMs. One of the common problems with SDMs is that they often work from species occurrences that have been opportunistically recorded, either by professionals or amateurs. A great challenge for data obtained from non-professional citizens, however, remains to ensure its standardization and quality (Kosmala et al. 2016). This requires a clear and effective design, solid volunteer training, and a high level of coordination that turns out to be complex (Brown and Williams 2019). Finally, it is essential to perform a quality validation following scientifically recognized standards, since they are often conditioned by errors and biases in obtaining information (Bird et al. 2014). There are two basic approaches to obtain the necessary data for this validation: getting it from an external source (external validation), or allocating a part of the database itself (internal validation or cross-validation) to this function. References [1] Bird TJ et al. (2014) Statistical solutions for error and bias in global citizen science datasets. Biological Conservation 173: 144-154. doi: 10.1016/j.biocon.2013.07.037 | How citizen science could improve Species Distribution Models and their independent assessment | Florence Matutini, Jacques Baudry, Guillaume Pain, Morgane Sineau, Josephine Pithon | <p>Species distribution models (SDM) have been increasingly developed in recent years but their validity is questioned. Their assessment can be improved by the use of independent data but this can be difficult to obtain and prohibitive to collect.... | | Biodiversity, Biogeography, Conservation biology, Habitat selection, Spatial ecology, Metacommunities & Metapopulations, Species distributions, Statistical ecology | Francisco Lloret | 2020-06-03 09:36:34 | ||
15 Jun 2020

Investigating the rare behavior of male parental care in great-tailed gracklesStudying a rare behavior in a polygamous bird: male parental care in great-tailed gracklesRecommended by Marie-Jeanne Holveck based on reviews by Matthieu Paquet and André C FerreiraThe Great-tailed grackle (Quiscalus mexicanus) is a polygamous bird species that is originating from Central America and rapidly expanding its geographic range toward the North, and in which females were long thought to be the sole nest builders and caretakers of the young. In their pre-registration [1], Folsom and collaborators report repeated occurrences of male parental care and develop hypotheses aiming at better understanding the occurrence and the fitness consequences of this very rarely observed male behavior. They propose to assess if male parental care correlates with the circulating levels of several relevant hormones, increases offspring survival, is a local adaptation, and is a mating strategy, in surveying three populations located in Arizona (middle of the geographic range expansion), California (northern edge of the geographic range), and in Central America (core of the range). This study is part of a 5-year bigger project. References [1] Folsom MA, MacPherson M, Lukas D, McCune KB, Bergeron L, Bond A, Blackwell A, Rowney C, Logan CJ. 2020. Investigating the rare behavior of male parental care in great-tailed grackles. corinalogan.com/Preregistrations/gmalecare.html In principle acceptance by PCI Ecology of the version on 15 June 2020 corinalogan/grackles/blob/master/Files/Preregistrations/gmalecare.Rmd. | Investigating the rare behavior of male parental care in great-tailed grackles | Folsom MA, MacPherson M, Lukas D, McCune KB, Bergeron L, Bond A, Blackwell A, Rowney C, Logan CJ | This is a PREREGISTRATION submitted for pre-study peer review. Our planned data collection START DATE is May 2020, therefore it would be ideal if the peer review process could be completed before then. Abstract: Great-tailed grackles (Quiscalus... | | Behaviour & Ethology, Biological invasions, Preregistrations, Zoology | Marie-Jeanne Holveck | 2019-12-05 17:38:47 | ||
06 Sep 2019
Assessing metacommunity processes through signatures in spatiotemporal turnover of community compositionOn the importance of temporal meta-community dynamics for our understanding of assembly processesRecommended by Werner Ulrich based on reviews by Joaquín Hortal and 2 anonymous reviewers
The processes that trigger community assembly are still in the centre of ecological interest. While prior work mostly focused on spatial patterns of co-occurrence within a meta-community framework [reviewed in 1, 2] recent studies also include temporal patterns of community composition [e.g. 3, 4, 5, 6]. In this preprint [7], Franck Jabot and co-workers extend they prior approaches to quasi neutral community assembly [8, 9, 10] and develop an analytical framework of spatial and temporal diversity turnover. A simple and heuristic path model for beta diversity and an extended ecological drift model serve as starting points. The model can be seen as a counterpart to Ulrich et al. [5]. These authors implemented competitive hierarchies into their neutral meta-community model while the present paper focuses on environmental filtering. Most important, the model and parameterization of four empirical data sets on aquatic plant and animal meta-communities used by Jabot et al. returned a consistent high influence of environmental stochasticity on species turnover. Of course, this major result does not come to a surprise. As typical for this kind of models it depends also to a good deal on the initial model settings. It nevertheless makes a strong conceptual point for the importance of environmental variability over dispersal and richness effects. One interesting side effect regards the impact of richness differences (ΔS). Jabot et al. interpret this as a ‘nuisance variable’ as they do not have a stringent explanation. Of course, it might be a pure statistical bias introduced by the Soerensen metric of turnover that is normalized by richness. However, I suspect that there is more behind the ΔS effect. Richness differences are generally associated with respective differences in total abundances and introduce source – sink dynamics that inevitably shape subsequent colonization – extinction processes. It would be interesting to see whether ΔS alone is able to trigger observed patterns of community assembly and community composition. Such an analysis would require partitioning of species turnover into richness and nestedness effects [11]. I encourage Jabot et al. to undertake such an effort. References [1] Götzenberger, L. et al. (2012). Ecological assembly rules in plant communities—approaches, patterns and prospects. Biological reviews, 87(1), 111-127. doi: 10.1111/j.1469-185X.2011.00187.x | Assessing metacommunity processes through signatures in spatiotemporal turnover of community composition | Franck Jabot, Fabien Laroche, Francois Massol, Florent Arthaud, Julie Crabot, Maxime Dubart, Simon Blanchet, Francois Munoz, Patrice David, Thibault Datry | <p>Although metacommunity ecology has been a major field of research in the last decades, with both conceptual and empirical outputs, the analysis of the temporal dynamics of metacommunities has only emerged recently and still consists mostly of r... | | Biodiversity, Coexistence, Community ecology, Spatial ecology, Metacommunities & Metapopulations | Werner Ulrich | 2018-11-29 14:58:54 | ||
24 May 2022
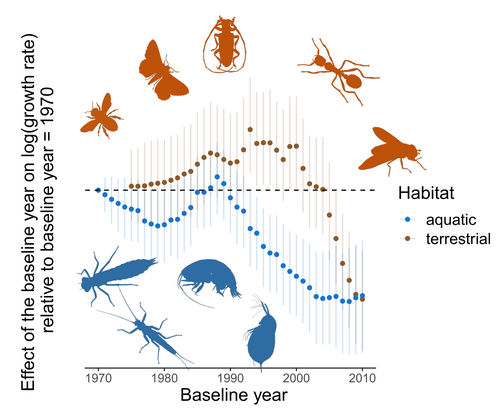
Controversy over the decline of arthropods: a matter of temporal baseline?Don't jump to conclusions on arthropod abundance dynamics without appropriate dataRecommended by Tim Coulson based on reviews by Gabor L Lovei and 1 anonymous reviewer
Humans are dramatically modifying many aspects of our planet via increasing concentrations of carbon dioxide in the atmosphere, patterns of land-use change, and unsustainable exploitation of the planet’s resources. These changes impact the abundance of species of wild organisms, with winners and losers. Identifying how different species and groups of species are influenced by anthropogenic activity in different biomes, continents, and habitats, has become a pressing scientific question with many publications reporting analyses of disparate data on species population sizes. Many conclusions are based on the linear analysis of rather short time series of organismal abundances. Duchenne F, Porcher E, Mihoub J-B, Loïs G, Fontaine C (2022) Controversy over the decline of arthropods: a matter of temporal baseline? bioRxiv, 2022.02.09.479422, ver. 3 peer-reviewed and recommended by Peer Community in Ecology. https://doi.org/10.1101/2022.02.09.479422 | Controversy over the decline of arthropods: a matter of temporal baseline? | François Duchenne, Emmanuelle Porcher, Jean-Baptiste Mihoub, Grégoire Loïs, Colin Fontaine | <p style="text-align: justify;">Recently, a number of studies have reported somewhat contradictory patterns of temporal trends in arthropod abundance, from decline to increase. Arthropods often exhibit non-monotonous variation in abundance over ti... | | Conservation biology | Tim Coulson | 2022-02-11 15:44:44 | ||
03 Apr 2020
Body temperatures, life history, and skeletal morphology in the nine-banded armadillo (Dasypus novemcinctus)Is vertebral count in mammals influenced by developmental temperature? A study with Dasypus novemcinctusRecommended by Mar Sobral based on reviews by Darin Croft and ?Mammals show a very low level of variation in vertebral count, both among and within species, in comparison to other vertebrates [1]. Jordan’s rule for fishes states that the vertebral number among species increases with latitude, due to ambient temperatures during development [2]. Temperature has also been shown to influence vertebral count within species in fish [3], amphibians [4], and birds [5]. However, in mammals the count appears to be constrained, on the one hand, by a possible relationship between the development of the skeleton and the proliferations of cell lines with associated costs (neural malformations, cancer etc., [6]), and on the other by the cervical origin of the diaphragm [7]. References [1] Hautier L, Weisbecker V, Sánchez-Villagra MR, Goswami A, Asher RJ (2010) Skeletal development in sloths and the evolution of mammalian vertebral patterning. Proceedings of the National Academy of Sciences, 107, 18903–18908. doi: 10.1073/pnas.1010335107 | Body temperatures, life history, and skeletal morphology in the nine-banded armadillo (Dasypus novemcinctus) | Frank Knight, Cristin Connor, Ramji Venkataramanan, Robert J. Asher | <p>The nine banded armadillo (*Dasypus novemcinctus*) is the only xenarthran mammal to have naturally expanded its range into the middle latitudes of the USA. It is not known to hibernate, but has been associated with unusually labile core body te... | | Behaviour & Ethology, Evolutionary ecology, Life history, Physiology, Zoology | Mar Sobral | 2019-11-22 22:57:31 | ||
09 Nov 2023
Mark loss can strongly bias estimates of demographic rates in multi-state models: a case study with simulated and empirical datasetsMarks lost in action, biased estimationsRecommended by Sylvain Billiard based on reviews by Olivier Gimenez, Devin Johnson and 1 anonymous reviewer
Capture-Mark-Recapture (CMR) data are commonly used to estimate ecological variables such as abundance, survival probability, or transition rates from one state to another (e.g. from juvenile to adult, or migration from one site to another). Many studies have shown how estimations can be affected by neglecting one aspect of the population under study (e.g. the heterogeneity in survival between individuals) or one limit of the methodology itself (e.g. the fact that observers might not detect an individual although it is still alive). Strikingly, very few studies have yet assessed the robustness of one fundamental assumption of all CMR-based inferences: marks are supposed definitive and immutable. If they are not, how are estimations affected? Addressing this issue is the main goal of the paper by Touzalin et al. (2023), and they did a very nice work. But, because the answer is not that simple, it also calls for further investigations. When and why would mark loss bias estimation? In at least two situations. First, when estimating survival rates: if an individual loses its mark, it will be considered as dead, hence death rates will be overestimated. Second, more subtly, when estimating transition rates: if one individual loses its mark at the specific moment where its state changes, then a transition will be missed in data. The history of the marked individual would then be split into two independent CMR sequences as if there were two different individuals, including one which died. Touzalin et al. (2023) thoroughly studied these two situations by estimating ecological parameters on 1) well-thought simulated datasets, that cover a large range of possible situations inspired from a nice compilation of hundreds of estimations from fish and bats studies, and 2) on their own bats dataset, for which they had various sources of information about mark losses, i.e. different mark types on the same individuals, including mark based on genotypes, and marks found on the soil in the place where bats lived. Their main findings from the simulated datasets are that there is a general trend for underestimation of survival and transition rates if mark loss is not accounting for in the model, as it would be intuitively expected. However, they also showed from the bats dataset that biases do not show any obvious general trend, suggesting complex interactions between different ecological processes and/or with the estimation procedure itself. The results by Touzalin et al. (2023) strongly suggest that mark loss should systematically be included in models estimating parameters from CMR data. In addition to adapt the inferential models, the authors also recommend considering either a double marking, or even a single but ‘permanent’ mark such as one based on the genotypes. However, the potential gain of a double marking or of the use of genotypes is still to be evaluated both in theory and practice, and it seems to be not that obvious at first sight. First because double marking can be costly for experimenters but also for the marked animals, especially as several studies showed that marks can significantly affect survival or recapture rates. Second because multiple sources of errors can affect genotyping, which would result in wrong individual assignations especially in populations with low genetic diversity or high inbreeding, or no individual assignation at all, which would increase the occurrence of missing data in CMR datasets. Touzalin et al. (2023) supposed in their paper that there were no genotyping errors, but one can doubt it to be true in most situations. They have now important and interesting other issues to address. References Frédéric Touzalin, Eric J. Petit, Emmanuelle Cam, Claire Stagier, Emma C. Teeling, Sébastien J. Puechmaille (2023) Mark loss can strongly bias demographic rates in multi-state models: a case study with simulated and empirical datasets. BioRxiv, ver. 3 peer-reviewed and recommended by Peer Community in Ecology. https://doi.org/10.1101/2022.03.25.485763 | Mark loss can strongly bias estimates of demographic rates in multi-state models: a case study with simulated and empirical datasets | Frédéric Touzalin, Eric J. Petit, Emmanuelle Cam, Claire Stagier, Emma C. Teeling, Sébastien J. Puechmaille | <p style="text-align: justify;">1. The development of methods for individual identification in wild species and the refinement of Capture-Mark-Recapture (CMR) models over the past few decades have greatly improved the assessment of population demo... | | Conservation biology, Demography | Sylvain Billiard | 2022-04-12 18:49:34 | ||
24 Nov 2023
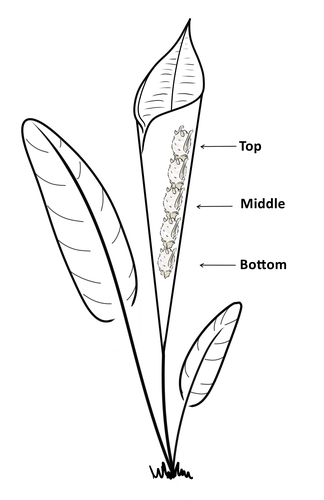
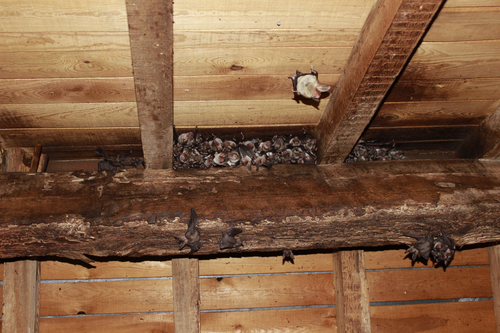
Consistent individual positions within roosts in Spix's disc-winged batsConsistent individual differences in habitat use in a tropical leaf roosting batRecommended by Corina Logan based on reviews by Annemarie van der Marel and 2 anonymous reviewers
Consistent individual differences in habitat use are found across species and can play a role in who an individual mates with, their risk of predation, and their ability to compete with others (Stuber et al. 2022). However, the data informing such hypotheses come primarily from temperate regions (Stroud & Thompson 2019, Titley et al. 2017). This calls into question the generalizability of the conclusions from this research until further investigations can be conducted in tropical regions. Giacomini and colleagues (2023) tackled this task in an investigation of consistent individual differences in habitat use in the Central American tropics. They explored whether Spix’s disc-winged bats form positional hierarchies in roosts, which is an excellent start to learning more about the social behavior of this species - a species that is difficult to directly observe. They found that individual bats use their roosting habitat in predictable ways by positioning themselves consistently either in the bottom, middle, or top of the roost leaf. Individuals chose the same positions across time and across different roost sites. They also found that age and sex play a role in which sections individuals are positioned in. Their research shows that consistent individual differences in habitat use are present in a tropical system, and sets the stage for further investigations into social behavior in this species, particularly whether there is a dominance hierarchy among individuals and whether some positions in the roost are more protective and sought after than others. References Giacomini G, Chaves-Ramirez S, Hernandez-Pinson A, Barrantes JP, Chaverri G. (2023). Consistent individual positions within roosts in Spix's disc-winged bats. bioRxiv, https://doi.org/10.1101/2022.11.04.515223 Stroud, J. T., & Thompson, M. E. (2019). Looking to the past to understand the future of tropical conservation: The importance of collecting basic data. Biotropica, 51(3), 293-299. https://doi.org/10.1111/btp.12665 Stuber, E. F., Carlson, B. S., & Jesmer, B. R. (2022). Spatial personalities: a meta-analysis of consistent individual differences in spatial behavior. Behavioral Ecology, 33(3), 477-486. https://doi.org/10.1093/beheco/arab147 Titley, M. A., Snaddon, J. L., & Turner, E. C. (2017). Scientific research on animal biodiversity is systematically biased towards vertebrates and temperate regions. PloS one, 12(12), e0189577. https://doi.org/10.1371/journal.pone.0189577 | Consistent individual positions within roosts in Spix's disc-winged bats | Giada Giacomini, Silvia Chaves-Ramirez, Andres Hernandez-Pinson, Jose Pablo Barrantes, Gloriana Chaverri | <p style="text-align: justify;">Individuals within both moving and stationary groups arrange themselves in a predictable manner; for example, some individuals are consistently found at the front of the group or in the periphery and others in the c... | | Behaviour & Ethology, Social structure, Zoology | Corina Logan | 2022-11-05 17:39:35 |


