
Gradient Boosted Trees can deliver more than accurate ecological predictions
 based on reviews by 2 anonymous reviewers
Modeling Tick Populations: An Ecological Test Case for Gradient Boosted Trees
Abstract
Recommendation: posted 17 November 2023, validated 27 November 2023
Poisot, T. (2023) Gradient Boosted Trees can deliver more than accurate ecological predictions. Peer Community in Ecology, 100532. 10.24072/pci.ecology.100532
Recommendation
Tick-borne diseases are an important burden on public health all over the globe, making accurate forecasts of tick population a key ingredient in a successful public health strategy. Over long time scales, tick populations can undergo complex dynamics, as they are sensitive to many non-linear effects due to the complex relationships between ticks and the relevant (numerical) features of their environment.
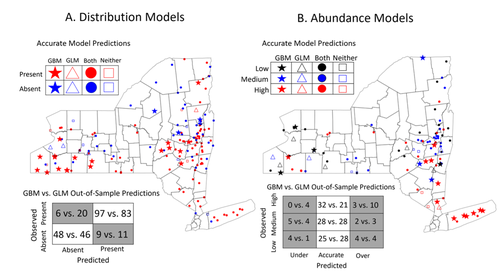
But luckily, capturing complex non-linear responses is a task that machine learning thrives on. In this contribution, Manley et al. (2023) explore the use of Gradient Boosted Trees to predict the distribution (presence/absence) and abundance of ticks across New York state.
This is an interesting modelling challenge in and of itself, as it looks at the same ecological question as an instance of a classification problem (presence/absence) or of a regression problem (abundance). In using the same family of algorithm for both, Manley et al. (2023) provide an interesting showcase of the versatility of these techniques. But their article goes one step further, by setting up a multi-class categorical model that estimates jointly the presence and abundance of a population. I found this part of the article particularly elegant, as it provides an intermediate modelling strategy, in between having two disconnected models for distribution and abundance, and having nested models where abundance is only predicted for the present class (see e.g. Boulangeat et al., 2012, for a great description of the later).
One thing that Manley et al. (2023) should be commended for is their focus on opening up the black box of machine learning techniques. I have never believed that ML models are more inherently opaque than other families of models, but the focus in this article on explainable machine learning shows how these models might, in fact, bring us closer to a phenomenological understanding of the mechanisms underpinning our observations.
There is also an interesting discussion in this article, on the rate of false negatives in the different models that are being benchmarked. Although model selection often comes down to optimizing the overall quality of the confusion matrix (for distribution models, anyway), depending on the type of information we seek to extract from the model, not all types of errors are created equal. If the purpose of the model is to guide actions to control vectors of human pathogens, a false negative (predicting that the vector is absent at a site where it is actually present) is a potentially more damaging outcome, as it can lead to the vector population (and therefore, potentially, transmission) increasing unchecked.
Boulangeat I, Gravel D, Thuiller W. Accounting for dispersal and biotic interactions to disentangle the drivers of species distributions and their abundances: The role of dispersal and biotic interactions in explaining species distributions and abundances. Ecol Lett. 2012;15: 584-593.
https://doi.org/10.1111/j.1461-0248.2012.01772.x
Manley W, Tran T, Prusinski M, Brisson D. (2023) Modeling tick populations: An ecological test case for gradient boosted trees. bioRxiv, 2023.03.13.532443, ver. 3 peer-reviewed and recommended by Peer Community in Ecology. https://doi.org/10.1101/2023.03.13.532443

The recommender in charge of the evaluation of the article and the reviewers declared that they have no conflict of interest (as defined in the code of conduct of PCI) with the authors or with the content of the article. The authors declared that they comply with the PCI rule of having no financial conflicts of interest in relation to the content of the article.
This work was supported by the NYSDOH, the National Institutes of Health (AI142572), and the Burroughs Welcome Fund (1012376
Reviewed by anonymous reviewer 1, 10 Oct 2023
The authors have done a great job of responding to the comment; I have nothing further to add.
Reviewed by anonymous reviewer 2, 04 Oct 2023
After having read the revised version of the manuscript, I would say that the authors have amended the texte according to our major remarks.
(very) minor comment : I woul rather talk about "pathogen dynamics" rather than "pathogen demography" (abstract L.24)
Evaluation round #1
DOI or URL of the preprint: https://doi.org/10.1101/2023.03.13.532443
Version of the preprint: 1
Author's Reply, 29 Aug 2023
Decision by Timothée Poisot, posted 29 Jun 2023, validated 29 Jun 2023
Both reviewers are positive about the study, and their comments generally deal with (i) a better justification of methodological choices, and (ii) more transparency in the interpretation of the results, in particular when it comes to discussing causal relationships infered with the GBM.
I would encourage the authors to pay attention to the comment from reviewer 2 about the need to repliacte the original formulation of models coming from other publications. This is an important point in order to set up a fair comparison of models -- this is not to say that deviations are inadmissible, but they must be strongly justified.
As some of the comments from the reviewers will lead to new (or updated) analyses, I am anticipating that I will send the revised version to review; with this in mind, please write a detailed response to the reviewers, in order to facilitate the next round of comments.
Reviewed by anonymous reviewer 2, 02 Jun 2023
Reviewed by anonymous reviewer 1, 19 May 2023
Manley et al present an interesting comparison of linear models and boosted regression trees in modelling tick distributions. The paper is succinct and nicely carried out, and I think it will make a good contribution to the literature. It builds largely on earlier published findings from the same group, which linked environmental variables with tick distributions. This paper therefore represents an improvement on their earlier findings as well as a case study investigating the utility of machine learning approaches compared to linear models. I’m not an expert in the machine learning approaches involved but the models appear to have been designed and fitted well, and the results make sense to me.
My one comment is that the authors don’t fully justify a few aspects of their modelling approach, which makes it unclear how direct the linear:BRT comparison is. If the authors could add a bit more detail and justification about the comparisons between the two (and the compromises involved in making the comparisons) that would help to critically assess the results.
· Why did the abundance approach use a multiclass model rather than actually predicting count? Would the results be the same?
· Did the linear models from the earlier paper use the same multiclass approach? If not, does that not introduce nonequivalences into the comparison of the models? I was confused about exactly what the response variables and model constructions were when reading both papers side by side; it seems like the previous approach used a linear model that was then categorised into the abundance classes after the predictions? If so, why not do the same here? The paper could do with a table or similar in the supplement that very simply presents this information side by side, detailing what the response variables are and which models they were incorporated in.
· If the linear models in the previous paper used different response variables/construction then they should ideally be repeated in this paper with identical formulations if possible. Otherwise it’s not totally clear whether the values reported are valid comparisons, or whether apples are being compared to oranges in some ways. I have no doubt that the BRTs are better at predicting the observed trends compared to linear models regardless, but it could influence the difference in predictive ability and therefore the strength of the argument. I would explicitly number and name the models (Model 1A, 1B, 2A, 2B etc) to make them easy to refer to in each area of the paper.
· If the linear models are repeated the authors could use a mixture model like a zero-inflated or hurdle model to examine presence and abundance in the same model rather than separating them (and log-transforming them wouldn’t be necessary with a negative binomial model), but for the purposes of this study it might be simplest just to log-transform the response when running the BRTs and running a more comparable model.
Minor points:
· Figure 1: map lines appear to be on top of points; the points would look better as the top layer with the map underneath.
· Figure 2B: This is possibly not the best choice of a relationship to display here, as this relationship could be quite easily approximated by a linear model applied to transformed data. If the authors are determined to stick with this relationship, it might be worth mentioning this.
· The line “deer harvest data, an estimate of deer population size, and nymphal tick abundance (Tran et al., 2021a).” At first reading it’s unclear if this is three variables or whether the middle one a description of the first. I’d suggest delineating the middle clause with brackets or an em-dash rather than commas.


