
Changes in behavioral flexibility to cope with environment instability: theoretical and empirical insights from serial reversal learning experiments
 based on reviews by Maxime Dahirel and 1 anonymous reviewer
Bayesian reinforcement learning models reveal how great-tailed grackles improve their behavioral flexibility in serial reversal learning experiments
Abstract
Recommendation: posted 19 August 2024, validated 20 August 2024
Coulon, A. (2024) Changes in behavioral flexibility to cope with environment instability: theoretical and empirical insights from serial reversal learning experiments. Peer Community in Ecology, 100468. https://doi.org/10.24072/pci.ecology.100468
Recommendation
Behavioral flexibility, i.e. the “ability to adapt behavior to new circumstances through packaging information and making it available to other cognitive processes” (Logan et al. 2023), appears as one of the crucial elements of responses of animal species to changing environments. Behavioral flexibility can change within the life of individuals, depending on their experience on the degree of variability and predictability of their surrounding environment. But little is known on the cognitive processes involved in these temporal changes in behavioral flexibility within individuals.
This is what Lukas et al. (2024) investigated very thoroughly, using the framework of serial reversal learning experiments on great-tailed grackles to study different aspects of the question. Behavioral flexibility as involved in serial reversal learning experiments was previously modeled as being made of two primary parameters: the rate of updating associations, phi (i.e. how fast individuals learn the associations between a cue and its associated reward or danger); and the sensitivity to the learned associations, lambda (i.e. how strong do individuals make their choices based on the associations they learned).
Lukas et al. (2024)* used a Bayesian reinforcement model to infer phi and lambda in individuals going through serial reversal learning experiments, to understand which of these two parameters explains most of the variation in grackle performance in serial reversal learning, how correlated they are, how they can change along time depending on an individual’s experience, how variable they can be among individuals, and whether they can predict performance in other contexts. But beforehand, the authors used an individual-based model to assess the ability of the Bayesian reinforcement model to correctly assess phi and lambda in their experimental design. They also used the Bayesian model to infer the range of values of phi and lambda an individual needs to exhibit to reduce errors in the serial reversal learning experiment.
Among other results, this study shows that in a context of rapidly changing but strongly reliable cues, the variation in the success of grackles is more associated with the rate of updating associations (phi) than the sensitivity to learned associations (lambda). Besides, phi increased within individuals along the serial reversal learning experiment, while lambda only slightly decreased. However, it is very interesting to note that different approaches could be adopted by different individuals through the training, leading them eventually to the same final performance: slightly different combinations of changes in lambda and phi lead to different behaviours but compensate each other in the end in the final success rate.
This study provides exciting insights into the cognitive processes involved in how changes in behavioral flexibility of individuals can happen in this type of serial learning experiments. But it also offers interesting openings to understand the mechanisms by which behavioral flexibility can change in the wild, helping individuals to cope with rapidly changing environments.
* Lukas et al. (2024) presents a post-study of the preregistered study Logan et al. (2019) that was peer-reviewed and received an In Principle Recommendation for PCI Ecology (Coulon 2019; the initial preregistration was split into 3 post-studies). A pre-registered study is a study in which context, aims, hypotheses and methodologies have been written down as an empirical paper, peer-reviewed and pre-accepted before research is undertaken. Pre-registrations are intended to reduce publication bias and reporting bias.
References
Coulon, A. (2019) Can context changes improve behavioral flexibility? Towards a better understanding of species adaptability to environmental changes. Peer Community in Ecology, 100019. https://doi.org/10.24072/pci.ecology.100019
Logan, CJ, Lukas D, Bergeron L, Folsom M, McCune, K. (2019). Is behavioral flexibility related to foraging and social behavior in a rapidly expanding species? In Principle Acceptance by PCI Ecology of the Version on 6 Aug 2019. http://corinalogan.com/Preregistrations/g_flexmanip.html
Dieter Lukas, Kelsey B. McCune, Aaron P. Blaisdell, Zoe Johnson-Ulrich, Maggie MacPherson, Benjamin M. Seitz, Augustus Sevchik, Corina J. Logan (2024) Bayesian reinforcement learning models reveal how great-tailed grackles improve their behavioral flexibility in serial reversal learning experiments. ecoevoRxiv, ver.4 peer-reviewed and recommended by Peer Community in Ecology https://doi.org/10.32942/osf.io/4ycps

The recommender in charge of the evaluation of the article and the reviewers declared that they have no conflict of interest (as defined in the code of conduct of PCI) with the authors or with the content of the article. The authors declared that they comply with the PCI rule of having no financial conflicts of interest in relation to the content of the article.
This research was funded by the Department of Human Behavior, Ecology and Culture at the Max Planck Institute for Evolutionary Anthropology.
Evaluation round #3
DOI or URL of the preprint: https://doi.org/10.32942/osf.io/4ycps
Version of the preprint: 3
Author's Reply, 23 Jul 2024
Dear Aurélie Coulon, Maxime Dahirel, and anonymous reviewer,
Thank you for the continued constructive feedback on our revised manuscript! We addressed the requested edits, and reply to the comments below (in bold). We agree that this process improved our manuscript!
In addition to the version with tracked changes that we uploaded at the PCI Ecology website, here are links to alternative versions of the article, depending on which you prefer:
-PDF at EcoEvoRxiv (version 4): https://ecoevorxiv.org/repository/view/3689/
-rmd file with the text and the code (version-tracked): https://github.com/corinalogan/grackles/blob/master/Files/Preregistrations/g_flexmanip2post.Rmd
Thank you so much for all of your help throughout this whole research process!
All our best,
Dieter Lukas (on behalf of all co-authors)
Revision round #3
Decision for round #3 : Revision needed
Minor revision needed
Dear Dr Lukas and collaborators,
The two reviewers who evaluated the previous version of your ms have sent comments on the revised version of your preprint entitled “Bayesian reinforcement learning models reveal how great-tailed grackles improve their behavioral flexibility in serial reversal learning experiments”.
Both of them are happy with the way you took their previous comments into account and your ms has now substantially improved. They made a number of minor suggestions that I recommend you take into account so that your ms is fully ready for a recommendation by PCI Ecology.
Best,
Aurélie Coulon,
Recommender, PCI Ecology.
by Aurélie Coulon, 17 Jul 2024 13:58
Manuscript: https://doi.org/10.32942/osf.io/4ycps
version: 3
Review by Maxime Dahirel, 10 Jul 2024 11:14
I have read the newly-revised version of the manuscript “Bayesian reinforcement learning models reveal how great-tailed grackles improve their behavioral flexibility in serial reversal learning experiments” by Lukas et al.
I mentioned in my previous review that I did not have any meaningful comments left on the substance, so my remaining comments were on the form. The authors have taken my previous comments into account, resulting in a much clearer manuscript on which I have not much to say. There are still a few points left where they slipped in their formatting, and I have tried to point them all. In a couple cases, the revision effort may have added new points needed clarification; I have tried to signal them all too.
Please see my comments below:
(1) Line 28: “in this experiment” is ambiguous, since the experiment in question is not mentioned before in the Abstract
Reply 1.1: We replaced this with “during serial reversal learning experiments” to clarify what the approach refers to.
(2) In the Introduction, I feel like the paragraphs starting line 75 and line 95 may work better if switched?
Reply 1.2: We did not switch the paragraphs because we think it is helpful to first have a description of what serial reversal learning experiments are (lines 77ff) before going into the details of which processes individuals might use during these experiments. To avoid repetition, we already provide the specific description of the experiments we used here, rather than first providing a generic description followed by a more specific explanation of the setup used here later.
(3) Lines 83-87: are these sentences really necessary in an Introduction?
Reply 1.3: As mentioned above, we think that it is helpful to provide a detailed description of what the birds experienced because this informs the considerations about the processes that individuals might use during these experiments.
(4) Line 123: You mention that lambda = 0 has a specific meaning. However, you fit models where lambda is estimated on a log link, so can never be equal to zero. Have you considered this discrepancy when implementing your model? (Note that this may be nothing wrong; lambda = 0 may well be a limit case that can never be reached, only approached)
Reply 1.4: Good point. In theory, there could be individuals whose lambda = 0 and who therefore pick options at random. However, to be included in our analyses, a bird had to reach the criterion of consistently choosing the rewarded option. A bird with a lambda = 0 would never reach this criterion, so we know that none of the birds included in our analyses had a lambda = 0. We added this explanation in the method section: “The limitation that, with an estimation on the log-scale $\lambda$ can never be equal to 0, is not an issue because we only included individuals in the analyses who did not pick options at random.”
(5) Equation placement: equations 1-3 and especially 1 are called in the text long before they appear (see e.g. line 113). While there are cases here this could be valid, usual practice is usually to present equation the first time they’re called. Please consider whether or not the way you present your reasoning warrants departing from this practice
Reply 1.5: To avoid confusion, we removed the direct references to the equations from the introduction and instead state “for details on the calculations see the section on the reinforcement learning model in the Methods”
(6) Line 325: priors are set on log(lambda) and logit(phi), not lambda and phi. The distinction is important and should be made clear
Reply 1.6: We changed the statement about the prior to “We set the priors for the logit of $\phi$ and the log of $\lambda$ to come from a normal distribution with a mean of zero and a standard deviation of one.”
(7) Line 362, but also later: strictly speaking, there is an argument that can be made that these linear model equations should also count towards the equation numbering
Reply 1.7: We discussed this, also based on a previous comment by the other reviewer. We decided not to number the formula for the statistical models because we were looking to McElreath (2020) as guidance, and in there these formulae are also not numbered.
(8) Line 362, and a lot of places elsewhere through the manuscript: the letter “x” is not a valid substitute for the multiplication sign (a.k.a. \times in LaTeX notation) in equations
Reply 1.8: Thank you for providing the LaTeX notation! We have changed this in all the equations.
(9) Line 368: mu should be in Greek, not Latin here. Please check for other similar issues
Reply 1.9: Thank you for noticing this. We checked all the notations again.
(10) Line 450: MVNormal should not be in italic, just as Normal isn’t is the same set of equations
Reply 1.10: Thank you, we changed MVNormal to be not italic.
(11) Line 491: there is a line break missing, I think?
Reply 1.11: Yes, thank you, we fixed this.
(12) Line 603: “reversal”, not “revrsal”
Reply 1.12: We corrected this.
(13) Line 608-609, but also elsewhere: there are mentions of lambda/phi being big or small throughout the text, but I don’t think I saw any point of reference for what would be a meaningfully small or large value?
Reply 1.13: In the introduction, we explain that that phi ranges between zero and one, and what these extreme values represent. Similarly, we explain that lambda has to be zero or larger, but that there is no upper bound. We removed the reference to small in this line and only report the values, and in the legend of Figure 3 repeat the limits that these values can take as a reference.
(14) Line 742: there is support for a U-shaped relationship, but the compatibility intervals are also compatible with horizontal straight lines (see Figures). This should be acknowledged
Reply 1.14: The different values across the range of the compatibility interval along the x-axis are not independent of each other. If, instead of the intervals, we would plot a sample of multiple curves from the posterior, these curves would span the same area as is shown in the compatibility intervals. However, each curve would show a U-shape, because the estimate for this parameter does not cross zero. This means that the estimates from the posterior are not compatible with horizontal straight lines.
(15) Figure 6: The figure (which uses full and broken lines) and its legend (which uses dots and squares) do not match each other
Reply 1.15: We changed the legend to match the figure.
Review by anonymous reviewer 1, 27 Jun 2024 13:40
Dear recommender and authors,
I have read the latest (version 3) of the paper “Bayesian reinforcement learning models reveal how great-tailed grackles improve their behavioral flexibility in serial reversal learning experiments” by Lukas and colleagues.
This version has been greatly improved since I first read it, and the authors have addressed most, if not all, of my criticisms (and those of the other reviewer, who also did an incredible job of providing feedback I must say). The abstract succinctly summarises the research objectives and results in a very understandable way, the introduction sets up the background well, the methods and results are now clearer (good job on the formatting of the equations and their explanation), and although I would still have put the "model test" as an appendix, the way it is now presented, inserted into the main text, and the way simulations are confronted with empirical data really adds up. So I would like to congratulate the authors for their persistence, their patience with my comments (and sometimes erroneous comments they had to answer anyway!), and especially for the final result. As a side note, here are some very minor comments/typos that may be adjusted as a last (and short) revision.
I hope I have not overlooked any other inconsistencies,
Thank you for allowing me to be part of this fascinating study,
Sincerely yours.
Comments:
L30: I would add “past” experiences.
Reply 2.1: We added “past” in line 40.
L49: I would consider removing “in another conception”.
Reply 2.2: We decided to keep this phrase to highlight the conceptual differences that appear to be present in the literature.
L92-93: After such a summary of the findings so far, I would have appreciated a short statement (one sentence) on what still needs to be explored (bridging with the following paragraph highlighting what is generally missing in any previous studies).
Reply 2.3: We added the following bridge sentence “To understand these changes in behavioral flexibility, we need approaches that can reflect how individuals might update their cognitive processes based on their experience.”
L109 and 119: I would delete the statement "the Greek letter...".
Reply 2.4: We decided to keep the statement for readers who might not be as familiar with mathematical notation, given that phi and lambda are key characters that we refer to repeatedly.
L232: Equation 2 is referenced, whereas Equation 1 was not. In general, the equation should also match the citation order. However, I can understand that this is not convenient in this case. Perhaps the authors will find a way.
Reply 2.5: We decided to refer to the equations at the point when we explain them (see also Reply 1.5). Here, we changed the text to “Choices during trials were based on the associations that individuals formed between each option and the reward based on their experience...Based on their choices, individuals updated their internal associations with the two options based on their individual learning rate.”
L325: For the sake of practicality, the fitting of λ and φ was done to transformed parameters in the modelling. However, in the current writing of the statistical equations, it is difficult to understand whether the authors are modelling/using the transformed/untransformed parameters (I, therefore, suddenly doubted why Gaussian models were used rather than beta models, and had to refer to the codes to allay these doubts). Perhaps labelling them as λ' and φ' when using the transformed parameters might be useful.
Reply 2.6: We changed the text to explain when we refer to logit phi and log lambda (see Reply 1.6).
L603: There is a typo "revrsal" should be "reversal" (e missing)
Reply 2.7: Thank you, we fixed this.
Figure 3: If I am not mistaken, the number of "Grackles first" does not match the sample size in the text. Are some points overlapping? I also suspect that the x-axis is cut off too early, because if I read Figure 4 correctly, a grackle is at a φ > 0.1.
Reply 2.8: As the legend explains, “The figure also shows the median 𝜙 and 𝜆 values estimated for the trained grackles”. The trained grackles are the eight individuals who experienced the serial reversal learning experiment. We focus on these individuals to show how the values changed during the serial reversal learning experiment. Figures 4 and 5 show the values for the full range of individuals.
L653: The reference to Figure 4 should in this case refer to panels a) and b). Otherwise, I think it would be more appropriate to refer to Figure 5.
Reply 2.9: The reference here was to the pattern in Figure 4 that in panel a), the number of trials increases from left to right, in panel b) the phi values decrease from left to right, and in panel c) there is no pattern in the lambda values from left to right. We were therefore referring to the comparison across all three panels, which is why we had referred directly to Figure 4. Figure 5 only shows the pattern for phi, but not for lambda. We added this explanation of the pattern to the references in this line “Figure 4, increase left to right in panel a), decrease in panel b), no pattern in panel c)”.
L715-716: I do not understand these sentences as they are written here, although I can see from the Figure 6 legend what the authors are referring to. I would encourage the authors to expand a bit here (as they have done in the figure legend) or simply remove it and leave it to the figure legend.
Reply 2.10: We added further explanations in the text “We illustrate how these differences in $\phi$ and $\lambda$ lead to slightly different ways of reaching the passing criterion during the final reversal. We used the values from the two individuals at the ends of the spectrum, the one with the highest $\phi$ and lowest $\lambda$, and the one with the lowest $\phi$ and highest $\lambda$, to explore how individuals switched from the previous option to the option that is now being rewarded.”
L719: If one had to be really picky, this is more of a magenta line than a red line (and this applies to other cases as well). Maybe use the standard red colour in this case, to avoid confusing non-colour-blind people?
Reply 2.11: We had changed the colour away from pure red based on a comment of a colour-blind co-author. We therefore keep the colour-blind friendly option, but changed the legend to refer to magenta.
L911: You miss the “on”: “for their constructive feedback ON…”
Reply 2.12: We changed this.
Decision by Aurélie Coulon, posted 17 Jul 2024, validated 19 Jul 2024
Dear Dr Lukas and collaborators,
The two reviewers who evaluated the previous version of your ms have sent comments on the revised version of your preprint entitled “Bayesian reinforcement learning models reveal how great-tailed grackles improve their behavioral flexibility in serial reversal learning experiments”.
Both of them are happy with the way you took their previous comments into account and your ms has now substantially improved. They made a number of minor suggestions that I recommend you take into account so that your ms is fully ready for a recommendation by PCI Ecology.
Best,
Aurélie Coulon,
Recommender, PCI Ecology.
Reviewed by Maxime Dahirel, 10 Jul 2024
I have read the newly-revised version of the manuscript “Bayesian reinforcement learning models reveal how great-tailed grackles improve their behavioral flexibility in serial reversal learning experiments” by Lukas et al.
I mentioned in my previous review that I did not have any meaningful comments left on the substance, so my remaining comments were on the form. The authors have taken my previous comments into account, resulting in a much clearer manuscript on which I have not much to say. There are still a few points left where they slipped in their formatting, and I have tried to point them all. In a couple cases, the revision effort may have added new points needed clarification; I have tried to signal them all too.
Please see my comments below:
(1)
Line 28: “in this experiment” is ambiguous, since the experiment in question is not mentioned before in the Abstract
(2)
In the Introduction, I feel like the paragraphs starting line 75 and line 95 may work better if switched?
(3)
Lines 83-87: are these sentences really necessary in an Introduction?
(4)
Line 123: You mention that lambda = 0 has a specific meaning. However, you fit models where lambda is estimated on a log link, so can never be equal to zero. Have you considered this discrepancy when implementing your model? (Note that this may be nothing wrong; lambda = 0 may well be a limit case that can never be reached, only approached)
(5)
Equation placement: equations 1-3 and especially 1 are called in the text long before they appear (see e.g. line 113). While there are cases here this could be valid, usual practice is usually to present equation the first time they’re called. Please consider whether or not the way you present your reasoning warrants departing from this practice
(6)
Line 325: priors are set on log(lambda) and logit(phi), not lambda and phi. The distinction is important and should be made clear
(7)
Line 362, but also later: strictly speaking, there is an argument that can be made that these linear model equations should also count towards the equation numbering
(8)
Line 362, and a lot of places elsewhere through the manuscript: the letter “x” is not a valid substitute for the multiplication sign (a.k.a. \times in LaTeX notation) in equations
(9)
Line 368: mu should be in Greek, not Latin here. Please check for other similar issues
(10)
Line 450: MVNormal should not be in italic, just as Normal isn’t is the same set of equations
(11)
Line 491: there is a line break missing, I think?
(12)
Line 603: “reversal”, not “revrsal”
(13)
Line 608-609, but also elsewhere: there are mentions of lambda/phi being big or small throughout the text, but I don’t think I saw any point of reference for what would be a meaningfully small or large value?
(14)
Line 742: there is support for a U-shaped relationship, but the compatibility intervals are also compatible with horizontal straight lines (see Figures). This should be acknowledged
(15)
Figure 6: The figure (which uses full and broken lines) and its legend (which uses dots and squares) do not match each other
https://doi.org/10.24072/pci.ecology.100468.rev31Reviewed by anonymous reviewer 1, 27 Jun 2024
Dear recommender and authors,
I have read the latest (version 3) of the paper “Bayesian reinforcement learning models reveal how great-tailed grackles improve their behavioral flexibility in serial reversal learning experiments” by Lukas and colleagues.
This version has been greatly improved since I first read it, and the authors have addressed most, if not all, of my criticisms (and those of the other reviewer, who also did an incredible job of providing feedback I must say). The abstract succinctly summarises the research objectives and results in a very understandable way, the introduction sets up the background well, the methods and results are now clearer (good job on the formatting of the equations and their explanation), and although I would still have put the "model test" as an appendix, the way it is now presented, inserted into the main text, and the way simulations are confronted with empirical data really adds up. So I would like to congratulate the authors for their persistence, their patience with my comments (and sometimes erroneous comments they had to answer anyway!), and especially for the final result. As a side note, here are some very minor comments/typos that may be adjusted as a last (and short) revision.
I hope I have not overlooked any other inconsistencies,
Thank you for allowing me to be part of this fascinating study,
Sincerely yours.
Comments:
L30: I would add “past” experiences.
L49: I would consider removing “in another conception”.
L92-93: After such a summary of the findings so far, I would have appreciated a short statement (one sentence) on what still needs to be explored (bridging with the following paragraph highlighting what is generally missing in any previous studies).
L109 and 119: I would delete the statement "the Greek letter...".
L232: Equation 2 is referenced, whereas Equation 1 was not. In general, the equation should also match the citation order. However, I can understand that this is not convenient in this case. Perhaps the authors will find a way.
L325: For the sake of practicality, the fitting of λ and φ was done to transformed parameters in the modelling. However, in the current writing of the statistical equations, it is difficult to understand whether the authors are modelling/using the transformed/untransformed parameters (I, therefore, suddenly doubted why Gaussian models were used rather than beta models, and had to refer to the codes to allay these doubts). Perhaps labelling them as λ' and φ' when using the transformed parameters might be useful.
L603: There is a typo "revrsal" should be "reversal" (e missing)
Figure 3: If I am not mistaken, the number of "Grackles first" does not match the sample size in the text. Are some points overlapping? I also suspect that the x-axis is cut off too early, because if I read Figure 4 correctly, a grackle is at a φ > 0.1.
L653: The reference to Figure 4 should in this case refer to panels a) and b). Otherwise, I think it would be more appropriate to refer to Figure 5.
L715-716: I do not understand these sentences as they are written here, although I can see from the Figure 6 legend what the authors are referring to. I would encourage the authors to expand a bit here (as they have done in the figure legend) or simply remove it and leave it to the figure legend.
L719: If one had to be really picky, this is more of a magenta line than a red line (and this applies to other cases as well). Maybe use the standard red colour in this case, to avoid confusing non-colour-blind people?
L911: You miss the “on”: “for their constructive feedback ON…”
https://doi.org/10.24072/pci.ecology.100468.rev32
Evaluation round #2
DOI or URL of the preprint: https://doi.org/10.32942/osf.io/4ycps
Version of the preprint: 2
Author's Reply, 21 Jun 2024
Dear Aurélie Coulon, Maxime Dahirel, and anonymous reviewer,
Thank you very much for the constructive comments on our revised manuscript! We appreciate the continued support to turn these additional analyses into a separate manuscript. Based on your feedback, we have now (1) changed the introduction to set a clearer frame that is building on the previous findings, (2) restructured the methods to link the different approaches to the questions they address, (3) changed the mathematical notation to make it consistent, and (4) checked the wording and presentation throughout. Please find our detailed replies to the comments below (in bold).
In addition to the version with tracked changes that we uploaded at the PCI Ecology website, here are links to alternative versions of the article, depending on which you prefer:
-PDF at EcoEvoRxiv (version 3): https://ecoevorxiv.org/repository/view/3689/
-rmd file with the text and the code (version-tracked): https://github.com/corinalogan/grackles/blob/master/Files/Preregistrations/g_flexmanip2post.Rmd
Thank you so much for all of your help throughout this whole research process!
All our best,
Dieter Lukas (on behalf of all co-authors)
Decision for round #2 : Revision needed
Revision needed
Dear Dr Lukas and collaborators,
Two reviewers have evaluated your preprint entitled “Bayesian reinforcement learning models reveal how great-tailed grackles improve their behavioral flexibility in serial reversal learning experiments”. They were the same who reviewed the first version of this ms you previously submitted to PCI Ecology.
Both reviewers acknowledge the effort you made to take their comments into account and think your manuscript is easier to read. However, both have the same conclusion that there are still issues which make the paper very difficult to follow. They made substantial and detailed comments and suggestions regarding the organization of the ms, the presentation of ideas, concepts and methods, and equation formatting. I recommend that you closely follow those proposals, so that your manuscript can better highlight the outcomes of your study.
Best,
Aurélie Coulon,
Recommender, PCI Ecology.
by Aurélie Coulon, 04 Apr 2024 12:33
Manuscript: https://doi.org/10.32942/osf.io/4ycps
version: 2
Review by Maxime Dahirel, 06 Mar 2024 11:49
I have read the revised version of the manuscript now entitled “Bayesian reinforcement learning models reveal how great-tailed grackles improve their behavioral flexibility in serial reversal learning experiments” by Lukas et al. Overall, I’m very satisfied with the way the authors have reworked their paper in response to our comments. The improvements are substantial and I commend the authors for the amount of work which must have been done, and I don’t have anything left to say about the substance of the manuscript. As such, all the comments I have left are about form or formatting, especially equation formatting. There are much, much fewer of them than in the previous version (the manuscript is also improved on that side!), but there are still there.
Importantly though, please do not consider the fact my comments are only of form now to handwave them as minor style disagreements; in a dense, concept- and equation-heavy manuscript such as this one, clarity is paramount, guesswork should be avoided, and there are still quite a few points in the manuscript where I had to guess.
R1 Reply: Thank you for your patience and diligence! Having this level of statistical detail in an article is new to us, so we appreciate the guidance on how to present this in an accurate way.
Please see my detailed comments below:
R1 COMMENT 1 - [this one is more of a remark or advice for the future, and can be safely ignored for the purposes of this revision if the authors do not want to re-run anything]
In my previous review, I mentioned the need of accounting for the uncertainty in phi and lambda when using them as predictors in subsequent models. I suggested several methods to do so, and the authors chose one, which I’m OK with. However, they noted in their reply that:
“The estimated phi and lambda values are predictor, not outcome variables, which is why the measurement error model does not appear appropriate in this case”.
This is actually not an issue; error-in-predictors models exist, and can be fitted easily with Stan. See ch. 15.1.2 in (McElreath, 2020), or the documentation of the brms package for examples of implementations.
R1 Reply 1: Thank you for the clarification. That will be helpful for future analyses. We had interpreted the models in the examples in ch 15.1.2 in McElreath 2020 as instances where there was a single measurement for each predictor variable, which is associated with an unknown error that is estimated as uncertainty in the model. This to us seemed different from the case here where we have multiple measurements for each predictor variable that reflect the uncertainty in the estimation. That is why we chose the alternative approach, and it is good to hear that our chosen approach addresses the problem you previously raised.
R1 COMMENT 2 - Please check the correct formatting of literature references throughout the text. In several cases, first/middle name initials appear when they shouldn’t (which may be rooted in the formatting in the bib file itself), and I’ve seen a few “(“ parentheses closed with “]” brackets rather than “)” ,or vice-versa. Examples can be found lines 61 or 863-865, but please check carefully everywhere. Also, at least one reference is left as its BibTex citation key rather than properly formatted (line 211, likely an @ missing in the raw Markdown). Finally, please note that in the References list at the end of the manuscript, the csl style that is used appears to auto-add “https://doi.org/” to whatever is in the URL/DOI field, leading to things like “https://doi.org/https://doi.org/10.1038/npp.2017.108” which while mostly harmless (the internal link still points to the right place) don’t look good.
R1 Reply 2: Thank you so much for catching all of these! We fixed the brackets so the in text citations show up properly, and we changed the .csl file so author initials don’t show up in the in text citations. The double doi.org in the URLs in the references was an error we made in the bibtex file, which we now fixed.
R1 COMMENT 3 - In a few places sentences may run a bit too long, and would benefit from added commas at least, and maybe being split in two in some cases. This one is extremely subjective as there are no egregious examples, so I am leaving it fully to the authors’ appreciation.
R1 Reply 3: We have gone through the text and tried to split sentences wherever possible.
R1 COMMENT 4 - There are several equation notation inconsistencies between batches of equations, but also within batches. While individually they are not catastrophic, their accumulation makes understanding what’s happening much, much more difficult that it ought to be. I again strongly recommend the authors follow a style guide; I suggest (Edwards & Auger‐Méthé, 2019) for an explicit one, but an implicit style such as the one in (McElreath, 2020) is fine as long as it is followed consistently.
Below are the main formatting “infractions” to convention I noticed. Please, please note that the specific line examples I give are examples and are not an exhaustive list, and the authors should go through the notation with a very fine comb again:
R1 Reply 4: thank you so much for the advice! The Edwards & Auger‐Méthé, 2019 reference is amazing! We went through and updated all of the equations and models so they are consistent within and between, per this comment and comments 4.1 through 4.10. For comment 4.7, we were able to put it in matrix notation as you suggested - thanks very much for this.
R1 COMMENT 4.1 - Inconsistent use and styling of indices (i,j,t…): sometimes they are as subscript, sometimes not; sometimes they are in brackets, sometimes not. This becomes especially problematic when word indices (bird, first, last) start to be used rather than only single letter one. Much more importantly for the comprehension of the equations, in some cases (especially the GLMMs later on) they are absent when they should be present (see e.g. equation block starting line 427, where I am fairly sure that several parameters are bird-specific (including phi, lambda, mu…) but do not have a bird index, when other have.
R1 COMMENT 4.2 - Use of different indices to mean the same thing. The “individual bird” index switches from “j” (Bayesian reinforcement model description) to “bird” (GLMM equation starting line 428) to “i” (line 517) after several equations of being forgotten (cf problem above)
R1 COMMENT 4.3 - Use of the same index to mean different things. “i” is used to denote an option in the Bayesian reinforcement model description, but an individual grackle later on (see above).
R1 COMMENT 4.4- Inconsistent or seemingly inconsistent styling of parameters: line 428, a and b are both italicized and not, on the same line. While this may refer to the fact the italicized version is a bird-specific parameter while the non-italicized is a population parameter, this is an extremely unclear styling choice, and it would be better to make another (Roman a for bird-specific and Greek alpha for population, for instance)
R1 COMMENT 4.5 - Missing line breaks in equation blocks (e.g. lines 428, 444)
R1 COMMENT 4.6 - Matrix notation at odds with convention (Rho and S not in bold lines 428-430)
R1 COMMENT 4.7 - Incorrect notation for the decomposition of the covariance matrix S into the diagonal matrices containing the SDs and the correlation matrix Rho (line 429). See 14.1.3 in (McElreath, 2020) for an example of correct notation
R1 COMMENT 4.8 - Greek letters written as plain Roman beyond the first mention cases the authors specifically discussed in their response (Rho line 430, lambda lines 753/762, phi line 803 and figure 7, the lambda ones being clearly LaTeX typos)
R1 COMMENT 4.9- Use of “code-like” notation in the middle of mathematical equations. For instance, the use of “*”, rather than “×” (line 428 and below), the persistence of “^” to denote superscript/power rather than actual superscripting, or the use of “dnorm()” when “Normal()” is meant (line 503 and below).
R1 COMMENT 4.10 - Not following the convention that equations should be part of sentences. An extremely minor one compared to the above, but this results in missing commas or periods, and in unnecessary repetitions. For instance, lines 248-249 or 260-261 could be simplified if following that convention.
R1 COMMENT 5 - Something that may or may not be related to COMMENT 4:
In the description of the Bayesian reinforcement model, the authors mention that phi and lambda are estimated on the logit and log-scale, respectively.
First, my understanding is that it’s simply because phi is a proportion (given its use in a 1- phi equation line 248) and lambda is strictly positive, so fitting the model and setting priors ultimately to logit(phi) and log(lambda) instead is a natural way to respect these constraints during estimation, and usual practice. However, that’s a slightly different rationale to the one mentioned by the authors line 280-282. For instance, I’m not sure the exponentiation in Eq. 2 line 260 has anything to do with lambda being estimated on the log-scale. If it actually does, then I missed something /something is missing in the description of the model, and log(lambda), not lambda should be what’s in Eq. 2.
And that’s where we arrive to the idea this comment may be related to COMMENT 4 about equation clarity. In this block of equations, and maybe all the following ones, it’s unclear where and when the authors mean to refer to phi/lambda or to logit(phi)/log(lambda) in their equations. Being explicit about it rather than implicit would greatly help understanding.
R1 Reply 5: Apologies for the confusions. You are correct, in the model phi and lambda are estimated as logit(phi) and log(lambda) to reflect the constraints on the possible values that they can assume. The exponentiation in Equation 2 is independent of this, it reflects the ‘normalized exponential’ (or softmax) function to convert the values into a probability distribution of the two outcomes. We have changed the text accordingly to explain both the estimation of the parameters and the exponentiation in the equation.
R1 COMMENT 6 - This is an unusual parameter choice for the Gamma-Poisson aka Negative Binomial, line 516 (reminder that the two terms refer to the same distribution).
First the choice of a discrete count model for a latency (continuous even if measured to a discrete amount of time) is unusual. Second, setting that aside, in most mu-based parametrisations of the Negative Binomial I’m familiar with, mu refer to the mean count, so higher mu mean higher values, contrary to what the authors state line 526. And the second parameter, while linked to overdispersion, is not equal to the SD, so it is usually not called sigma, to avoid confusion. (see COMMENT 4).
At this point, I’m not clear if this is simply a notation issue, a parametrization issue (this distribution can be parametrized with mean and precision, mean and (over)dispersion, or with the Gamma shape and scale parameters), or something else, like a previous reference using “Gamma-Poisson” to mean something different to what is usually meant in the literature. In any case, some clarification is needed, possibly with a reference.
R1 Reply 6: Sorry about the parameter confusion! The Gamma-Poisson parameters are usually phi and lambda, but we wanted to avoid those because they are used in a different context in this article. We can see how mu and sigma are confusing here though because that is standard notation for a normal distribution. We changed these parameters to m and s. We also fixed the explanations. We had initially thought of reflecting latency as the inverse of a rate of something happening: if something happens a lot, the latency until it happens again will be shorter. However, you are correct in that we implemented a model where we estimate latency directly, rather than indirectly from what happens. In this case, higher rates (counts) means more seconds, and therefore a longer latency. We had interpreted the outcomes as such in the results and in discussion, but not changed the explanation in the methods accordingly. We also clarify that the second parameter is linked to the variation in the overall distribution. We had chosen the Gamma-Poisson because we considered our measure of latency a count of seconds (Poisson), with a skewed distribution because the mean rate of waiting differs among birds (Gamma). We have added these explanations for the choices to the description of the model.
R1 COMMENT 7 - The authors consistently use the term “correlation” to refer to parameters that are emphatically not correlations, but instead slopes/coefficients from their models (see paragraph starting line 667 for some of the most flagrant examples, but this is present throughout the Results). Correlations are bound between -1 and 1, while slopes/coefficients from a model linear part are not.
R1 Reply 7: Thank you for pointing out the distinction between correlations and correlation coefficients. We have changed the presentation of the results throughout (“here and hereafter, we report the posterior mean slope of the association with the 89% compatibility interval”). We still use the term correlation when describing that, overall, two variables are negatively or positively statistically associated.
MINOR COMMENTS
R1 C8 - Line 29: species name should be italicized
R1 C9 - Line 69: “greek" should be “Greek”, capitalized
R1 C10 - Line 267: should be “P” italicized, not “*P” non-italicised; seems to be a Markdown typo
R1 Reply 8-10: We fixed these, thank you!
R1 C11 - Line 292: the authors say they use the posterior package to sample the model posterior, but do not describe the number of samples/chain in the initial model they are sampling from (contrary to later on)
R1 Reply 11: We added the information that we ran 4 chains with 2000 samples each.
R1 C12 - Line 317-318: maybe make it clearer that it is one run of simulations (there are 640 simulated individuals, not e.g. 640 * 1000 simulations).
R1 Reply 12: We changed the description of the agent-based model, and clarified that for a total of 640 individuals we simulated once their choices during a reversal learning experiment.
R1 C13 - Line 355-357: To clarify, this refers to posterior predictive checks, right? (Gabry et al., 2019)
R1 Reply 13: It does not seem to be exactly the same as the posterior predictive checks in Gabry et al 2019, because we did not always generate data from the models. We assessed whether the slope of the predicted correlations fell within the data range, and we now explain this in the method section. Posterior predictive checks of the implementation of the Bayesian reinforcement learning model were part of an earlier article (Blaisdell et al. 2021 10.24072/pcjournal.44).
R1 C14 - Line 436-437: shouldn’t it be “equals 0” and “equals 1” respectively, following usual notation of linear models?
R1 Reply 14: Yes, thank you, we changed this to “one from the beginning (𝑟 = 0) and one from the end of the serial reversal experiment (𝑟 = 1)”.
R1 C15 - Line 439: the content between parentheses is very unclear; should that be something like “bird-specific intercepts and bird-specific changes are drawn from a bivariate normal distribution with non-zero correlations between the two”?
R1 Reply 15: We added more explanation to the model, including a definition of all the parameters and the distributions.
R1 C16 - Figure 1: Unless the bird on the figure was drawn by one of the authors, the artist should be credited (and even then, I’d argue; highlight scientist-artists!), and the licence mentioned. (as an aside, if needed, there is one public domain grackle illustration in Phylopic)
R1 Reply 16: the image of the bird that we used had a CC0 license, which is why we didn’t provide photo credit. We replaced it with one of the grackle photos that Dieter Lukas took, and we provided photo credit and the license in the figure caption.
R1 C17 - Figure 2 to 6, 8: “phi” is lower-case in the figure axes labels, but upper-case everywhere else in the manuscript. The legend mentions lines around the points to denote confidence intervals, but these are absent from the actual figure.
R1 Reply 17: Thanks for spotting this. We added the intervals to the estimated values in Figure 2. We changed all the figures to add the correct notation for phi. While we did this, we also changed the color scheme on all of the figures to make them more accessible.
R1 C18 - Figure 4: A tiny design choice makes the figure a bit harder to understand than it ought to be. The use of horizontal but not vertical grid lines make it seem like the horizontal division of the figure plane in 4 parts has a meaning; then readers might wonder, even for a bit, why “unlikely to reach criterion” corresponds to y values lower than 2.5 and “likely” between 5 and 7.5. I would suggest to remove the horizontal lines, plus maybe to color the “likely” and “unlikely” regions of the plot to remove ambiguity
R1 Reply 18: Thank you for the suggestion. We made the changes to the previous Figure 4 - now Figure 3 (removed horizontal lines and added shading to the two regions). We agree that this makes the main message easier to understand.
R1 C19 - Line 858: “IGrackles” should be “Grackles”
R1 C20 - Recurring: as the authors follow most of the usual Bayesian naming conventions, the use of “confidence intervals” should maybe be replaced by “credible”/”compatibility”…
R1 Reply 19-20: We fixed the typo and updated “confidence intervals” to say “compatibility intervals” throughout.
REFERENCES
Edwards, A. M., & Auger‐Méthé, M. (2019). Some guidance on using mathematical notation in ecology. Methods in Ecology and Evolution, 10(1). https://doi.org/10.1111/2041-210X.13105
Gabry, J., Simpson, D., Vehtari, A., Betancourt, M., & Gelman, A. (2019). Visualization in Bayesian workflow. Journal of the Royal Statistical Society: Series A (Statistics in Society), 182(2). https://doi.org/10.1111/rssa.12378
McElreath, R. (2020). Statistical rethinking: A Bayesian course with examples in R and Stan (2nd edition). Chapman and Hall/CRC.
Review by anonymous reviewer 1, 03 Apr 2024 17:10
R2 C0
I apologise for the time it has taken me to provide feedback on the paper. It has been a long time since the original submission, so I admit to reading it almost as a new paper. Overall, I noticed an important effort to improve the contextualisation of the study. However, I still find the paper very difficult to follow. This is not only because of the density of the analyses (there are indeed many, and I would encourage the authors to focus on fewer questions for further work), but also because it seems that the paper is a patchwork of somewhat disconnected analyses (first a modelling test, then a test of the two drivers of reversal ability, and finally a test of how behavioural flexibility is related to performance). In addition, I still believe that the paper in its current form cannot be considered a “stand alone” paper.
R2 Reply 0: Thank you for going through our revised manuscript in such detail. We have changed the framing and structure to refocus the manuscript. For the details, see our replies below.
R2 C1 - This is due, in my opinion, to (a) many references, without brief summaries, to other work by the team (including previous work from which this paper has been extracted). I understand that one cannot repeat everything said in previous papers, and that this part of the paper was not originally intended to stand alone, but a minimum of additional explanation is needed (e.g. L152 or L490-493).
R2 Reply 1: Thanks for this perspective. In our initial attempt to make this a separate, stand-alone, manuscript from the articles we previously published, we had decided to give this manuscript a completely new focus. We now realize that this leads to confusion. We have rewritten the introduction to explain how the analyses we present in this manuscript arose from our previous studies. We added a paragraph in the introduction that summarizes the previous methods and findings, and we build the predictions from these.
R2 C2.1
(b) Some parts relevant only to this paper are still unclear for two reasons. First, the explanations are distilled bit by bit when the authors had to use them. This seems efficient for people who know the whole setting, but not for people who are mostly naive to the whole framework. For example, it would be essential to distinguish clearly and sequentially between (1) the empirical setting, (2) the agent-based model, and (3) the statistical models, rather than following the research question titles and adding each of these parts for each question.
R2 Reply 2.1: We have moved information from the research questions into the rewritten introduction. This helps with setting the frame of the different aspects our manuscript combines. We link the research questions to whether they rely on the agent-based model, the mathematical derivations, or the empirical setting. We also link the questions back to the approaches in the methods, and repeat this information in the result section to clarify what approach each result was based on.
R2 C2.2 - Second, the authors often assume that the readers are experts in the field or even in their study case/framework. They regularly refer to certain elements without having defined them properly beforehand (e.g. “the parameters” L145, which we assume are the ones described at length without any certainty, “the models”, L165, “the performance”, L147). This is true, in my opinion, for the “background” in the introduction or for the methods (e.g. L152, why is 17 out of 20 for a difference from what is expected by chance?), which makes it difficult to follow the reasoning or even to be critical of it.
R2 Reply 2.2: During the rewriting of the introduction and the methods, we paid attention to explaining terms on their first usage. We also checked to make sure that terms are used consistently rather than in different contexts. The additional information on the previous studies we added in the introduction now provides further context on particular decisions taken during the experiment (e.g. that the rule to set 17 out of the last 20 trials as passing criterion was based on this being a significant association according to the chi-square test).
R2 C3 - (c) The paper mixes both “theoretical” and “empirical” efforts. However, a theoretical and an empirical narrative are often different in order to be clearly understood. At present, I feel that the presentation of the theoretical part (e.g. modelling and formulas) lacks a certain formalism. I personally found it very difficult to understand how the modelling works. As a note, I still have mixed feelings about this modelling part overall (see comments on the Bayesian model). I really think that the authors should decide whether this paper should be considered a major “methodological advance” (which I don’t think it is, although it is true that the model may have been tuned for these specific analyses. However, this kind of hand-tuning is often done to adapt to the study system and research questions), or an “empirical test” (which I think it is).
R2 Reply 3: You are correct in that our main aim with this manuscript was to better understand the behavioral flexibility of great-tailed grackles. On the theoretical side, the focus is on the empirical insights that the novel methodology of the Bayesian reinforcement learning model can provide in a context where it previously seems to have not been applied. Accordingly, we still think this manuscript benefits from a description of what the method does and how to apply it, so that others can best judge when and how to adapt it as part of their research. Because the Bayesian reinforcement learning models seem not to have been used on these kinds of temporal data before (and also only very rarely on reversal learning data in general), we feel that we first need to show that the method works to answer the questions we are interested in. In our understanding, this goes beyond ‘tuning’, which is why we added the simulations as a proof of concept. We restructured our introduction to clarify our main aim with this manuscript, and to explain how the different theoretical and empirical parts come together to address this.
R2 C4 - Below, I offer point-by-point comments which I hope will help the authors to see why I have had difficulty in understanding, and therefore evaluating, this piece of research. I admit that I am not the most expert in this area of research, but I hope that these comments will highlight what a more naive reader might find problematic in reading it.
Best regards.
1 MAJOR COMMENTS
Abstract: The emphasis in the presentation is on the methodology used (both the “Bayesian” approach and the combination of simulation and experiments). However, in the presentation of the results, the Bayesian model, the simulation or the experiments used are not explained per se (and sometimes come out of the blue, as in L42-43), nor how they were combined. I would encourage the authors to present their research questions, methods and results in a more step-by-step manner. Moreover, some crucial information is missing (e.g. sample sizes; quantification of the magnitude of effects, such as how the performance of grackles, which is not defined, varies in the puzzle box test). Some terms are also vague (e.g. L35, although somehow understandable after reading the whole paper, the use of “phase” may not be immediately obvious to a novice).
R2 Reply 4: We rewrote the abstract to match the revised structure of the manuscript.
R2 C5 - 1.1 Introduction
• The first paragraph mixes an explanation of the general context (L51 to 55) with a presentation of methodological approaches (serial reversal experiments). I find this confusing. In this line I would move L49-51 to L55, after the citation. Also, I do not see the point of introducing the experimental approach now, and would move this to 1.2 Research questions paragraph 4, where this methodological background is presented.
R2 Reply 5: We restructured the introduction following these suggestions by first introducing the general context, and moving the description of the approaches after the description of the experiments. We also combine the theoretical advances in understanding the potential cognitive processes underlying behavioral flexibility with the methodological advances to estimate these processes with the Bayesian reinforcement learning model.
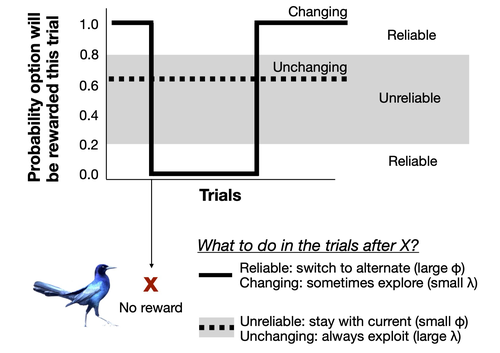
R2 C6 - I am confused. The wording in the text suggests that the updating of associations is related to the change and reliability of the environment. A contrario, in the figure it is only related to the reliability of the environment, as if a process (updating associations or sensitivity of associations) is related to an aspect of the environment (change over time and reliability). I would encourage the authors to clarify this. In addition, the authors treat φ and λ as separate and even opposite. The problem with this correlation has been raised before, but it is even more glaring here: the current presentation of this background is inconsistent with L494, where this anticorrelation is only “expected”, and challenges research question 3), for which φ and λ may explain the birds’ performance differently (which should be impossible to disentangle if they are indeed negatively correlated). However, as shown in Figure 4, there is a relationship (hence an interaction) of the two parameters together on the performance of the birds. I am sure I am misunderstanding some of this and would encourage the authors to make the link between the compatibility of the statements more explicit.
R2 Reply 6: We recognize that the confusion arose because we had previously mixed predictions for what would be the best behavior during a single reversal with what would be the best behavior during the serial reversal learning experiment. During a single reversal, individuals can show different approaches to gain the reward consistently. These different approaches are characterized by different values of phi and lambda. We illustrate this in Figure 6. However, if individuals experience serial reversals, the range of possible phi and lambda values that lead to an efficient behavior is much more limited. Our focus in the manuscript is now on the behavior at the end of the serial reversal learning experiment. We focus our predictions specifically on this. For this serial reversal learning experiment, where cues are consistently reliable but changes are frequent, we predict and show that individuals need to have large phi values to efficiently obtain the reward. The revised figure (previously figure 4, now figure 3) now shows this dependency on phi. The difference to the previous version of the figure is that we now assume that individuals need to change their associations between cues and the reward, rather than starting from fresh without any previous associations. We think that this distinction between the approaches shown during a single reversal versus the overall efficiency during the serial reversal learning experiment clarifies the previously confusing statements about how phi and lambda might change independently even if both influence the behavior.
R2 C7 - A large part of the introduction is devoted to methodology. However, as far as I understand, this is not a methodological paper. I would therefore encourage the authors to increase the description of the biological scenarios of interest (as presented in the second paragraph) and to reduce the methodological description. In addition, it is sometimes unclear why some aspects are discussed at length (e.g. the three “types” of information L116 to 126 - which I would not actually consider as types), as they do not seem to be “exploited” afterwards.
R2 Reply 7: In the introduction, we increased the description of the biological observations we are aiming to explain. We also reduced the methodological description, combining only the relevant information on how individuals might approach serial reversal learning experiments with what we measure in this study.
R2 C8 - 1.2 Research questions
Overall, the research questions are long and the authors could aim for a more concise pre- sentation.
R2 Reply 8: We have shortened the text under each research question.
R2 C9 - L184 - It is unclear what “abstract” means: how did the models differ from the experiments? Also, I do not understand the argument about differences in estimates between models and experiments. If the models were intended to evaluate the optimal strategy, then it is not necessarily the model structure that may cause differences, but that animals may not behave optimally in nature. Could the authors clarify this statement?
R2 Reply 9: We removed this statement from underneath the research question. We instead integrated the information on what has previously been done, and how our research builds on this, to the introduction. The main difference of our models to the models that were previously published by others is that we investigate the temporal changes in behavioral flexibility that individuals show in response to experiencing particular conditions. The previously published models were evolutionary models, where the authors investigated which combinations of phi and lambda might be expected to be selected over time in different environments. These environments were abstract, setting different fixed rates of changes and reliabilities in the rewards. The evolutionary models therefore do not reflect directly how individuals phenotypically change their behavioral flexibility as they experience their environment, both because of the time scales and because of the choice of parameters to reflect particular environments.
R2 C10 - L199 - Why would φ and λ not interact to describe the performance of individuals? (as sug- gested by the “or”) Question 3) The prediction is not consistent with the research question (which aims to understand which of the factors explains more variation in performance).
R2 Reply 10: We changed the research questions and predictions to match the distinction between the expected influence of phi and lambda on the behavior of individuals during a single reversal and the expected changes during the serial reversal learning experiment (see Reply R2.6).
R2 C11 - L221 - It seems to me that the authors alternate between behaviours and strategies. I think this is not the same thing (a strategy could consist of one to many behaviours to start with) and the authors should stick to one word.
R2 Reply 11: We checked the text to refer to ‘behavior’ when referring to what one individual does, and to ‘approaches’ when comparing different behaviors exhibited by two or more individuals.
R2 C12 - 1.3 Methods
Bayesian model
I find it disconcerting to be presented with the statistical model before the “observational data” (whether from simulation or experiment) are presented. I suggest that the authors restructure the methods in a more classical way, distinguishing between what leads to “data” (simulation scenarios, experimental protocols, etc.) and what is “analysis”.
R2 Reply 12: We changed the structure in the methods to first describe the three datasets we used (simulations, grackle serial reversal, grackle multi-option puzzle box), followed by the reinforcement learning model that is key to all further analyses, before moving on to the specific analyses for each question.
R2 C13 - Furthermore, in this model I notice a lack of the definition of parameters. For example, the interval for defining association values is not mentioned.
R2 Reply 13: Following the advice of reviewer 1, we clarified the mathematical notation of equation 1, adding a clearer index that the equation estimates “how the associations…change from one trial to the next”.
R2 C14 - L305 to 313 As I understand it, modelling association changes across choice events is in- evitable of the mechanistic model used (rather than the explanation offered in L305-306). It is therefore not helpful to me (and perhaps to other readers) to have these after the “Implementation” section. The authors might therefore consider structuring the statistical modelling by distinguishing between (1) the background, with the equations, (2) the param- eterisation, and finally (3) the implementation (i.e. using Stan/R), and (4) the validation.
R2 Reply 14: The description in these lines referred to a separate, mathematical approach. We added explanations about this approach in the method sections of the questions that it is relevant for. We used the equations to derive predictions about expected choices in the reversal learning experiment. This approach is separate from the implementation of the Bayesian reinforcement learning model, which backwards inferred parameters from the observed behavioral choices. We structured the method section to have, after the description of the data, the background, including the equations, of the Bayesian reinforcement learning model. This is followed by the parametrization and implementation. After this, we describe for each of the questions the analyses that were used to address these.
R2 C15 - I don’t understand what a categorical likelihood means. My understanding of this model, and of mechanistic models in general, is that the equations allow the authors to estimate, for each event and individual, the probability of its realisation, given some values of φ and λ. The likelihood can therefore be the product of these probabilities: the best-fitting model (i.e. a particular combination of φ and λ) is identified when this product is maximised.
R2 Reply 15: Apologies for the confusion. We meant to refer to the categorical distribution (or generalized Bernoulli distribution), which we used to determine which of the options individuals would actually choose given their associations. The equations only calculate the probability that an individual will choose a given option. The step using the categorical distribution links the probabilities to which of the different options was observed to be chosen and which was not. We have changed the text to clarify this.
R2 C16 - It is not specified that these models were fitted at the individual level (which they certainly were, as the authors obtained φ and λ for each bird). I think this should be specified.
R2 Reply 16: We now clarified the notation in the equations and models to indicate when a term applied at the individual level.
R2 C1 - L281: Is the logit scale for the values obtained positive? From equation 1, it seems to me that the authors use the inverse logit (or so I assume from “logit scale”) to constrain a value of φ between 0 and 1 (so positive, yes, but not only).
R2 Reply 17: Yes, as also mentioned by reviewer 1, the logit scale was used to constrain the values for phi between 0 and 1 to reflect that this is a proportion. We clarified this in the manuscript.
R2 C18 Question 1) - In these simulations, I don’t see the point of having 32 populations if these populations are (almost) perfectly identical, since they can only differ in the range of the parameters being studied? Also, if any combination of φ and λ is possible, this violates the expecta- tion/description that both parameters are opposite. Could the authors specify what insights can be gained from modelling unrealistic conditions (e.g. high φ and high λ, etc.)? Overall, the explanation of the simulation is not clear enough and relies too much on the previous publication by Logan et al, 2023. I think it is important that the paper can be read without necessarily reading all of the authors’ previous work, and would therefore encourage them to provide more detail on this modelling task.
R2 Reply 18: Following your advice to focus on the empirical aspects, we have reduced the analyses of the simulation data in the manuscript. We now only use these agent-based simulations to assess the power and feasibility of the Bayesian reinforcement learning models to detect changes during the reversal learning experiments. As answer to the question that is raised here, the combination of high phi values and low lambda values is what we learned to be the relevant combination in these serial reversal learning experiments. Other combinations of phi and lambda are not impossible, in fact we would expect all combinations depending on the environment that an individual experiences (for example, low phi and high lambda in an environment that changes rarely but is unpredictable).
R2 C19 - L346-347: Why should a slope of 1 be assumed? In my opinion, it will give evidence of a correlation, but not necessarily a match, if a is not zero.
R2 Reply 19: Yes, thanks, the match is expected if the intercept is at 0 and the slope is close to 1. We have changed this accordingly in the methods and in the results.
R2 C20 Question 3) In order not to break the flow of the paper, I would encourage authors to include the information on research permissions in a different section (e.g. at the end of the manuscript).
R2 Reply 20: Good point. We moved it to a new section at the end of the document called Ethics.
R2 C21 Question 4) - Authors can continue to refer to birds as “bird” or “j” in the equations.
R2 Reply 21: Thanks for this. We now refer to birds as subscript b and made this consistent throughout the manuscript.
R2 C22 - The equations seem inaccessible to most readers. For example, the meaning of MVNormal(), L428, LKJcorr() L430, and the associated explanation (I think for the first one) L439-440 is unclear to me.
R2 Reply 22: We added further descriptions of all the parameters in the models, including explanation for these functions.
R2 C23 Question 6) - What is the unit of latency?
R2 Reply 23: The latency unit is the number of seconds, which we now clarify in the text.
R2 C24 - A correlation between φ and λ may (or may not) affect the quality of the fit (i.e. the value of the estimates). This has been raised before, but I may have missed how the authors investigated it (and thus whether it was consequential or not). Also, there are problems with the colours of the curve and the confidence intervals (they are different). Finally, I do not see the point of clustering the trials, even for “clarity”.
R2 Reply 24: Following your advice to focus on the empirical aspects, we have reduced the analyses of the simulation data in the manuscript. We removed the analyses mentioned here and the corresponding figure.
R2 C25 - 1.4 Results Overall, the readability of the results would be improved by a more concise and ‘recognisable’ notation (e.g. presentation of confidence intervals between square brackets).
R2 Reply 25: We made the results more streamlined by introducing the mean and the 89% compatibility interval on the first mention, and then not mentioning this text thereafter, which greatly reduces the amount of text in this section.
R2 C26 - In my opinion, this first paragraph questions the need to include testing the model as a research question, and I was not fully convinced by the authors’ response. As suggested by the other reviewer, if I am not mistaken, the structure of the simulated data and the model are the same, so we simply expect the model to accurately capture the simulation parameters.
R2 Reply 26: The agent-based simulation reflects the stochasticity in the choices. Based on learned associations, individuals have a certain probability to choose the rewarded option: for example, at the beginning of the experiment, individuals have no information. They are somewhat attracted to both options, because they might be curious, but which of the two options they choose is random. Even after they have experienced both the rewarded and the unrewarded options, they might choose the unrewarded option in any given trial. In addition, an individual that by chance chooses the unrewarded option in the first trial is expected to show a different set of choices afterwards than an individual who did choose the rewarded option. These two factors introduce noise when using the phi and lambda values to simulate choices. On the flip side, because of the probabilistic decisions a given short series of choices (e.g. rewarded [r], followed by non-rewarded [n], followed by r, n, r, r, n, r) can occur even if individuals have different phi and lambda values. Over more choices we might expect differences though among individuals because the underlying associations, and how these translate into choices, will change differently according to the different phi and lambda values. In question 1, we want to know what sample per individual is necessary to re-infer the correct phi and lambda values from the choices despite this noise. We clarified this in the research question and in the methods.
R2 C27 - Figure 3: I have a naive question: since the modelling is based on a log-linear relationship, how come the predicted curves can have a sigmoid-like pattern? Is it because of the logit transformation? But I think this curve corresponds to λ (for which there is no such transformation, am I right?).
R2 Reply 27: We deleted the previous figure 3 (see R2 Reply 24). The non-linear patterns shown in this figure, and some of the other figures which are still in the manuscript, reflect the results from the statistical models, not the Bayesian reinforcement learning model per se. In these statistical models, we sometimes also have different links between the distribution of the outcome and the predictor variables. For example, the statistical model for the results presented in Figure 5 has a log-link, the statistical model for the results presented in Figure 7 has a logit-link.
R2 C28 - Figure 2: I would include the results for both φ and λ. Also, I am unclear as to why only 30 individuals are shown when, if I followed correctly, many more were simulated?
R2 Reply 28: We changed the figure to show the results for all simulated individuals for both phi and lambda.
R2 C29 - L549-553: These sentences are unclear to me. In particular, I do not understand why this is related to the observed shift, nor how this explanation is actually valid.
R2 Reply 29: We clarified how the mis-estimation of the values from small samples affects both phi and lambda in a linked way: The model assumed that the simulated individuals would not require a large phi because a small difference in the associations would already be informative. Individuals would then be expected to consistently choose the option that was just rewarded, and they would because of their large lambda. In addition, these shifts mean that phi and lambda are no longer estimated independently. The model estimated that if, an individual had a particularly low phi value, it would require a particularly high lambda value.”
R2 C30 - L597-624: What research question is this really referring to? It is supposed to answer Q2, but this was not explained in the associated methods. Also, please be more specific in the manuscript in general. What is “this likely trade-off” here? I understand it to be the one between φ and λ, but it seems less clear why this should be likely (despite, I acknowledge, the many previous explanations).
R2 Reply 30: We changed this section 2 to match it to the frame focusing on serial reversal learning experiments. We made the research question more explicit, added details in the methods, and expanded on the mathematical derivations in the result section.
R2 C31 - L689-692: Have the authors explored from simulations the φ and λ estimates when considering multiple reversals? Are these also correct?
R2 Reply 31: The agent-basedsimulation data we used here were initially generated for a different purpose, where we were only interested in the behavior during a single reversal. We have not explored simulations of multiple reversals. With the revised focus of this manuscript on the behavior in serial reversal learning experiments, we therefore removed some of the analyses of the simulated data because they did not speak to the serial reversal paradigm. We did not expand on the simulations because we realized that we can generate more specific predictions also with an analytical approach (question 2).
R2 C32 - L721: I don’t understand what this estimate refers to. Is it the one associated with the variable reversal? In this case, it would be good to add the variable being examined for each estimate.
R2 Reply 32: We have checked the results throughout to explain in the text what association the reported results represent. In this case, we found that “individuals who had higher lambda values in the beginning did not necessarily have higher lambda values than other individuals at the end of the serial reversal learning, with values at the beginning not associated with values at the end (+0.17, -0.67 to +0.97, n=8 grackles).”
R2 C33 - L711-732: Overall, I am confused, because as I understand it, the first lines (L711 to 722) indicate that there is a homogenisation of φ and λ over the experiment between grackles. But then it seems that individuals have different “strategies” overall? Does the strategy refer to the final values or to the changes in φ and λ? If so, why is this a “strategy”?
R2 Reply 33: We removed the reference to strategies, as we can only describe the behavior of individuals (see R2 Reply 11). We also now explain the difference between the variation that might occur among individuals within a single reversal, and the changes that are expected for all individuals experiencing the serial reversal learning experiment (see R2 Reply 6).
R2 C34 - Figure 7: Is the difference between the curves really significant? I do not know what equation was used to calculate this probability (see my comment in the Minor Com- ments for the need to give this information), but certainly a confidence interval can be calculated and should be added to the figure.
R2 Reply 34: We expanded the description of the methods for these mathematical derivations. We added the specific approach to the section of the respective question in the methods. The curves are derived mathematically as exact estimations, they are not estimated from data. With such an approach, we know that the two curves are different, and because they are exact rather than based on samples we also cannot speak about significance.
R2 C35 - 1.5 Discussion L779-807: This is a very long summary of the results. Although appreciated (given the amount of analysis), it would be even more efficient to try to link it to some “ecological” or “behavioural” statement (e.g. avoid mentioning φ and λ, but what they represent behaviourally).
R2 Reply 35: We have shortened the first paragraph of the discussion, focussing on how these results can help us understand how the grackles changed their behavioral flexibility during the serial reversal learning experiment.
R2 C36 - L808-836: It is unclear how these lines discuss results, and it seems more like a justi- fication for such a modelling approach (which would fit in either the introduction or methods). I would encourage the author to reduce this part, perhaps by focusing only on the key technical aspects that have been shown to be necessary for these models to be efficient (i.e. the inclusion of at least one reversal event).
R2 Reply 36: We moved part of this paragraph to the revised introduction. We kept in the discussion the interpretation of the additional insights that we gained from choosing this alternative approach.
R2 C37 - L845: It is unclear to me for what exactly λ “seems more important” (for performance vs. φ?). And what does setting a threshold mean? That λ has an on and off effect, with grackle performance either very low or very high? I do not recall the results being consistent with this view. Can the authors be more specific?
R2 Reply 37: We removed the corresponding results, the figure, and the text mentioned here in the discussion that relate phi and lambda to the behavior during a single reversal because we now focus on how phi and lambda link to the choices in the serial reversal learning experiment.
R2 C38 - MINOR COMMENTS In my opinion, all equations should be numbered (including those of the statistical mod- elling, L341-345 and so on) and referenced in the results section when quoting the estimates (otherwise I personally had trouble identifying which equation the authors used). In these equations, I would also stick to either mathematical writing or “reader-friendly” writing (with explicit names of variables, etc.), but not both. Also, what is dnorm(), which is used from equation L501. Is it a normal/Gaussian distribution?
R2 Reply 38: The equations 1 through 3b are numbered and these are the only equations in the manuscript. For the models and their priors, it is standard practice not to number these (see McElreath 2020). We fixed the notation throughout the manuscript (see our response 4 to reviewer 1). dnorm() is a normal distribution, and we fixed these terms throughout.
R2 C39 - Figure 1: sometimes explore should be always explore, as opposed to “always exploit”, shouldn’t it?
R2 Reply 39: No, in the context of the serial reversal learning experiment it should be ‘sometimes explore’. If the behavior would be ‘always explore’, that means individuals choose randomly during every trial. Such a strategy to always explore might only be relevant if the changes occur too rapidly for an individual to learn anything.
R2 C40 - L69 and 76 - I do not think it is necessary to specify what the letter is in Latin. I would just stick to the Greek version throughout the manuscript.
R2 Reply 40: We revised the text so that we always refer to the Greek version throughout the manuscript, except in this first instance where we explain what it is.
R2 C41 - L100 and 104 - I think comments like “the label of the rate is different from author to author” are more confusing than helpful. I would delete them.
R2 Reply 41: We deleted this comment. We had added the comment to show the links to other fields, which have used similar approaches with different terminology. However, the additional background we now provide in the introduction about the approach should make it clear that we are referring to the same processes that others have been using without needing this comment.
R2 C42 - L102 - Please include the numbers of the equations.
R2 Reply 42: We added the equation numbers.
R2 C43 - L363 - A Poisson distribution assumes that the mean and variance are equal. So have you controlled for the problem of overdispersion? If so, you can mention it. If not, you may want to consider alternative models (e.g. negative binomial; although the modelling here seems robust to the distribution you used, as the results did not change from a Gaussian model).
R2 Reply 43: We did not use a Gamma-Poisson/negative binomial model to explain variation in the number of trials individuals needed to reach the criterion because we did not perceive any obvious outliers. The varying effects in this model also induce additional dispersion around the Poisson mean. We do use a negative binomial model for the latency to attempt a new option on the multi-option puzzle box, because some individuals very quickly moved on while others took a very long time. There, we do explain the additional parameter (“$s$ controls the the variance, with larger values meaning the overall distribution is more like a pure Poisson process in which all grackles have the same rate”).
R2 C44 - L443 - This equation is also based on a discrete output variable, so a Gaussian model does not appear to be the best choice. If there is always a decrease in the number of trials (from last to first) then it can be related to count data and could be modelled as a Poisson distri- bution, I think.
R2 Reply 44: Our rationale here was that the process of adding/subtracting independent variables leads to a Gaussian distribution. We checked, and changing the distribution to Poisson does not change the results. We decided to keep the Gaussian distribution because the model outcome is on the original data scale, rather than having the log transformation for the Poisson.
R2 C45 - L677 - “... no clear association” between? I assumed number of trials and φ and λ, from the brackets, but I would appreciate it if the authors could always be specific.
R2 Reply 45: We thought that adding this information would have introduced too much repetition. We agree though that this made it confusing. With the change to the presentation of the results, we also went through to check that the text specifies the tested associations.
R2 C46 - Figure 6: Shouldn’t there be 19 grackle points? I count less (perhaps an imposed limit in the script?) It is also unclear to me how we can deduce the statement of L675-676 from this figure. Could the authors highlight the grackles that also tested for reversal?
R2 Reply 46: Yes, there should have been 19 grackles in the previous figure 6. The plot had set the x-axis limit based on the simulated data, which had a smaller range than the values observed among the grackles. We have fixed this in the figure. We also added the data for the trained grackles from their final serial reversal.
R2 C47 - L701-702: Could the authors be more specific? I could help a lot by always specifying the magnitude and direction of the effect (here, for example, not ‘changes’ but the ‘increase in’).
R2 Reply 47: We clarified the direction of the effect. We decided to have the figures be the main way to illustrate the effects and their magnitude because many of the parameters we infer have no easily describable natural meaning. For example, this relationship is visualized in Figure 5.
R2 C48 - L746-748: This should be in the methods, not the results, and linked to the appropriate reference (Logan et al., 2023?).
R2 Reply 48: We moved this information to the new paragraph in the introduction, and included the relevant reference.
R2 C49 - L779-780: More mechanistic than? And in what sense? And what are the additional find- ings? This is also mentioned later, but to start the paragraph in this way is, in my opinion, vague and not very informative.
R2 Reply 49: This summary sentence was part of our previous framing that this article introduced a new approach to existing data. We have changed this sentence, and the first paragraph of the discussion, to focus on the changes in behavioral flexibility during the serial reversal learning experiment: “Our analyses show that grackles change their behavioral flexibility to match the reliability and stability of the environment they experience.”
R2 C50: L241 - Mathematical notation “belongs to” before the ensemble is missing
R2 Reply 50: We assume you are referring to line 249 in the previous version of the manuscript. Following the suggestions of reviewer 1, we rewrote the mathematical notations. In the text for this case, where there were two options, we changed it to “Equation 1 estimates how the associations A, that individual b forms between the two different options (o option 1 or 2) and their expected rewards, change”.
R2 C51: I certainly did not catch all of them, but there were a significant number of typos. Here are a few
R2 Reply 51: Thank you so much for catching these! We fixed them (comments R2 C52-C67). We also checked the remainder of the manuscript for typos and errors.
R2 C52: L29 - Species name should be in italics
R2 C53: L61 - Bond et al, 2007 citation format shows problem (square brackets do not match)
R2 C54: L66 - Problem citing Chow et al., 2015
R2 C55: L211 - Problem with citation
R2 C56: L267 to 272 - Double paragraph
R2 C57: L444 - Part related to “a” should go to next line. The same problem exists in L464.
R2 C58: L538 - A space is missing after “shifted”.
R2 C59: L594 - Some words are missing/were not deleted? “and the to reach. . . ”
R2 C60: L675 - A period is missing after “(Figure 6)”.
R2 C61: L721 - A space is missing after “+0.17”.
R2 C62: L753 - L762 Correct “$lambda”.
R2 C63: L800 - There are two full stops at the end of the sentence.
R2 C64: L803 - Correct the phi of the Greek letter.
R2 C65: L814 - The quote from Warren is doubled.
R2 C66: L858 - Remove the ‘I’ from ‘IGrackles’.
R2 C67: L876 - Isn’t “grackles” missing after “what strategies”?
Decision by Aurélie Coulon, posted 04 Apr 2024, validated 04 Apr 2024
Dear Dr Lukas and collaborators,
Two reviewers have evaluated your preprint entitled “Bayesian reinforcement learning models reveal how great-tailed grackles improve their behavioral flexibility in serial reversal learning experiments”. They were the same who reviewed the first version of this ms you previously submitted to PCI Ecology.
Both reviewers acknowledge the effort you made to take their comments into account and think your manuscript is easier to read. However, both have the same conclusion that there are still issues which make the paper very difficult to follow. They made substantial and detailed comments and suggestions regarding the organization of the ms, the presentation of ideas, concepts and methods, and equation formatting. I recommend that you closely follow those proposals, so that your manuscript can better highlight the outcomes of your study.
Best,
Aurélie Coulon,
Recommender, PCI Ecology.
Reviewed by Maxime Dahirel, 06 Mar 2024
I have read the revised version of the manuscript now entitled “Bayesian reinforcement learning models reveal how great-tailed grackles improve their behavioral flexibility in serial reversal learning experiments” by Lukas et al.
Overall, I’m very satisfied with the way the authors have reworked their paper in response to our comments. The improvements are substantial and I commend the authors for the amount of work which must have been done, and I don’t have anything left to say about the substance of the manuscript. As such, all the comments I have left are about form or formatting, especially equation formatting. There are much, much fewer of them than in the previous version (the manuscript is also improved on that side!), but there are still there.
Importantly though, please do not consider the fact my comments are only of form now to handwave them as minor style disagreements; in a dense, concept- and equation-heavy manuscript such as this one, clarity is paramount, guesswork should be avoided, and there are still quite a few points in the manuscript where I had to guess.
Please see my detailed comments below:
COMMENT 1
[this one is more of a remark or advice for the future, and can be safely ignored for the purposes of this revision if the authors do not want to re-run anything]
In my previous review, I mentioned the need of accounting for the uncertainty in phi and lambda when using them as predictors in subsequent models. I suggested several methods to do so, and the authors chose one, which I’m OK with. However, they noted in their reply that:
“The estimated phi and lambda values are predictor, not outcome variables, which is why the measurement error model does not appear appropriate in this case”.
This is actually not an issue; error-in-predictors models exist, and can be fitted easily with Stan. See ch. 15.1.2 in (McElreath, 2020), or the documentation of the brms package for examples of implementations.
COMMENT 2
Please check the correct formatting of literature references throughout the text. In several cases, first/middle name initials appear when they shouldn’t (which may be rooted in the formatting in the bib file itself), and I’ve seen a few “(“ parentheses closed with “]” brackets rather than “)” ,or vice-versa. Examples can be found lines 61 or 863-865, but please check carefully everywhere. Also, at least one reference is left as its BibTex citation key rather than properly formatted (line 211, likely an @ missing in the raw Markdown). Finally, please note that in the References list at the end of the manuscript, the csl style that is used appears to auto-add “https://doi.org/” to whatever is in the URL/DOI field, leading to things like “https://doi.org/https://doi.org/10.1038/npp.2017.108” which while mostly harmless (the internal link still points to the right place) don’t look good.
COMMENT 3
In a few places sentences may run a bit too long, and would benefit from added commas at least, and maybe being split in two in some cases. This one is extremely subjective as there are no egregious examples, so I am leaving it fully to the authors’ appreciation.
COMMENT 4
There are several equation notation inconsistencies between batches of equations, but also within batches. While individually they are not catastrophic, their accumulation makes understanding what’s happening much, much more difficult that it ought to be. I again strongly recommend the authors follow a style guide; I suggest (Edwards & Auger‐Méthé, 2019) for an explicit one, but an implicit style such as the one in (McElreath, 2020) is fine as long as it is followed consistently.
Below are the main formatting “infractions” to convention I noticed. Please, please note that the specific line examples I give are examples and are not an exhaustive list, and the authors should go through the notation with a very fine comb again:
- Inconsistent use and styling of indices (i,j,t…): sometimes they are as subscript, sometimes not; sometimes they are in brackets, sometimes not. This becomes especially problematic when word indices (bird, first, last) start to be used rather than only single letter one. Much more importantly for the comprehension of the equations, in some cases (especially the GLMMs later on) they are absent when they should be present (see e.g. equation block starting line 427, where I am fairly sure that several parameters are bird-specific (including phi, lambda, mu…) but do not have a bird index, when other have.
- Use of different indices to mean the same thing. The “individual bird” index switches from “j” (Bayesian reinforcement model description) to “bird” (GLMM equation starting line 428) to “i” (line 517) after several equations of being forgotten (cf problem above)
- Use of the same index to mean different things. “i” is used to denote an option in the Bayesian reinforcement model description, but an individual grackle later on (see above).
- Inconsistent or seemingly inconsistent styling of parameters: line 428, a and b are both italicized and not, on the same line. While this may refer to the fact the italicized version is a bird-specific parameter while the non-italicized is a population parameter, this is an extremely unclear styling choice, and it would be better to make another (Roman a for bird-specific and Greek alpha for population, for instance)
- Missing line breaks in equation blocks (e.g. lines 428, 444)
- Matrix notation at odds with convention (Rho and S not in bold lines 428-430)
- Incorrect notation for the decomposition of the covariance matrix S into the diagonal matrices containing the SDs and the correlation matrix Rho (line 429). See 14.1.3 in (McElreath, 2020) for an example of correct notation
- Greek letters written as plain Roman beyond the first mention cases the authors specifically discussed in their response (Rho line 430, lambda lines 753/762, phi line 803 and figure 7, the lambda ones being clearly LaTeX typos)
- Use of “code-like” notation in the middle of mathematical equations. For instance, the use of “*”, rather than “×” (line 428 and below), the persistence of “^” to denote superscript/power rather than actual superscripting, or the use of “dnorm()” when “Normal()” is meant (line 503 and below).
- Not following the convention that equations should be part of sentences. An extremely minor one compared to the above, but this results in missing commas or periods, and in unnecessary repetitions. For instance, lines 248-249 or 260-261 could be simplified if following that convention.
COMMENT 5
Something that may or may not be related to COMMENT 4:
In the description of the Bayesian reinforcement model, the authors mention that phi and lambda are estimated on the logit and log-scale, respectively.
First, my understanding is that it’s simply because phi is a proportion (given its use in a 1- phi equation line 248) and lambda is strictly positive, so fitting the model and setting priors ultimately to logit(phi) and log(lambda) instead is a natural way to respect these constraints during estimation, and usual practice. However, that’s a slightly different rationale to the one mentioned by the authors line 280-282. For instance, I’m not sure the exponentiation in Eq. 2 line 260 has anything to do with lambda being estimated on the log-scale. If it actually does, then I missed something /something is missing in the description of the model, and log(lambda), not lambda should be what’s in Eq. 2.
And that’s where we arrive to the idea this comment may be related to COMMENT 4 about equation clarity. In this block of equations, and maybe all the following ones, it’s unclear where and when the authors mean to refer to phi/lambda or to logit(phi)/log(lambda) in their equations. Being explicit about it rather than implicit would greatly help understanding.
COMMENT 6
This is an unusual parameter choice for the Gamma-Poisson aka Negative Binomial, line 516 (reminder that the two terms refer to the same distribution).
First the choice of a discrete count model for a latency (continuous even if measured to a discrete amount of time) is unusual. Second, setting that aside, in most mu-based parametrisations of the Negative Binomial I’m familiar with, mu refer to the mean count, so higher mu mean higher values, contrary to what the authors state line 526. And the second parameter, while linked to overdispersion, is not equal to the SD, so it is usually not called sigma, to avoid confusion. (see COMMENT 4).
At this point, I’m not clear if this is simply a notation issue, a parametrization issue (this distribution can be parametrized with mean and precision, mean and (over)dispersion, or with the Gamma shape and scale parameters), or something else, like a previous reference using “Gamma-Poisson” to mean something different to what is usually meant in the literature. In any case, some clarification is needed, possibly with a reference.
COMMENT 7
The authors consistently use the term “correlation” to refer to parameters that are emphatically not correlations, but instead slopes/coefficients from their models (see paragraph starting line 667 for some of the most flagrant examples, but this is present throughout the Results). Correlations are bound between -1 and 1, while slopes/coefficients from a model linear part are not.
MINOR COMMENTS
C8 - Line 29: species name should be italicized
C9 - Line 69: “greek" should be “Greek”, capitalized
C10 - Line 267: should be “P” italicized, not “*P” non-italicised; seems to be a Markdown typo
C11 - Line 292: the authors say they use the posterior package to sample the model posterior, but do not describe the number of samples/chain in the initial model they are sampling from (contrary to later on)
C12 - Line 317-318: maybe make it clearer that it is one run of simulations (there are 640 simulated individuals, not e.g. 640 * 1000 simulations).
C13 - Line 355-357: To clarify, this refers to posterior predictive checks, right? (Gabry et al., 2019)
C14 - Line 436-437: shouldn’t it be “equals 0” and “equals 1” respectively, following usual notation of linear models?
C15 - Line 439: the content between parentheses is very unclear; should that be something like “bird-specific intercepts and bird-specific changes are drawn from a bivariate normal distribution with non-zero correlations between the two”?
C16 - Figure 1: Unless the bird on the figure was drawn by one of the authors, the artist should be credited (and even then, I’d argue; highlight scientist-artists!), and the licence mentioned. (as an aside, if needed, there is one public domain grackle illustration in Phylopic)
C17 - Figure 2 to 6, 8: “phi” is lower-case in the figure axes labels, but upper-case everywhere else in the manuscript. The legend mentions lines around the points to denote confidence intervals, but these are absent from the actual figure.
C18 - Figure 4: A tiny design choice makes the figure a bit harder to understand than it ought to be. The use of horizontal but not vertical grid lines make it seem like the horizontal division of the figure plane in 4 parts has a meaning; then readers might wonder, even for a bit, why “unlikely to reach criterion” corresponds to y values lower than 2.5 and “likely” between 5 and 7.5. I would suggest to remove the horizontal lines, plus maybe to color the “likely” and “unlikely” regions of the plot to remove ambiguity
C19 - Line 858: “IGrackles” should be “Grackles”
C20 - Recurring: as the authors follow most of the usual Bayesian naming conventions, the use of “confidence intervals” should maybe be replaced by “credible”/”compatibility”…
REFERENCES
Edwards, A. M., & Auger‐Méthé, M. (2019). Some guidance on using mathematical notation in ecology. Methods in Ecology and Evolution, 10(1). https://doi.org/10.1111/2041-210X.13105
Gabry, J., Simpson, D., Vehtari, A., Betancourt, M., & Gelman, A. (2019). Visualization in Bayesian workflow. Journal of the Royal Statistical Society: Series A (Statistics in Society), 182(2). https://doi.org/10.1111/rssa.12378
McElreath, R. (2020). Statistical rethinking: A Bayesian course with examples in R and Stan (2nd edition). Chapman and Hall/CRC.
https://doi.org/10.24072/pci.ecology.100468.rev21
Reviewed by anonymous reviewer 1, 03 Apr 2024
Evaluation round #1
DOI or URL of the preprint: https://doi.org/10.32942/osf.io/4ycps
Version of the preprint: 1
Author's Reply, 09 Feb 2024
Dear Aurélie Coulon, Maxime Dahirel, and anonymous reviewer,
Thank you very much for the helpful comments on this manuscript! We really appreciate the time you have taken over the years for this piece of research, especially this article that developed as an addition to the initial preregistration. Based on your feedback, we have now (1) reframed the manuscript from a post-hoc addition to having its own clear focus on applying Bayesian reinforcement learning models to serial reversal experiments, (2) restructured the manuscript to more clearly explain the rationale for the different analyses and we link these from the introduction through the methods and results, (3) added explanations that were missing from the methods, and (4) checked the wording and presentation throughout. Please find our detailed replies to the comments below (the attached pdf contains the same text but is formatted to show the replies in bold).
In addition to the version with tracked changes that we uploaded at the PCI Ecology website (almost all of the text has changed or been moved), here are links to alternative versions of the article, depending on which you prefer:
-PDF at EcoEvoRxiv (version 2): https://ecoevorxiv.org/repository/view/3689/
-rmd file with the text and the code (version-tracked): https://github.com/corinalogan/grackles/blob/master/Files/Preregistrations/g_flexmanip2post.Rmd
Thank you so much for all of your help throughout this whole research process!
All our best,
Dieter Lukas (on behalf of all co-authors)
Round #1
by Aurélie Coulon, 08 Nov 2022 15:22
Manuscript: https://doi.org/10.32942/osf.io/4ycps
Revision needed for the preprint "Behavioral flexibility is manipulatable and it improves flexibility and problem solving in a new context: post-hoc analyses of the components of behavioral flexibility"
Dear Dr Lukas and collaborators,
Two reviewers have assessed your preprint called “Behavioral flexibility is manipulatable and it improves flexibility and problem solving in a new context: post-hoc analyses of the components of behavioral flexibility”. One of them, Maxime Dahirel, also reviewed the 2 other post-study manuscripts of the preregistration that received in principle recommendation on 26 mar 2019.
Based on these reviews and my reading of your preprint, I think it has a good potential interest. However, several aspects need to be worked, especially to make your work clearer (more explanations of the theory and of the methods, more streamlining of the analyses and results) and more convincing. For example, some aspects related to the simulation work are unclear, which makes its goals and interpretation uncertain. The two reviewers made very precise and extensive comments, that will be important to take into account to reveal the potential of your work.
Best,
Aurélie Coulon,
Recommender, PCI Ecology.
Reviewer 1
Reviewed by Maxime Dahirel, 27 Oct 2022 19:28
I have now read the manuscript entitled “Behavioral flexibility is manipulatable and it improves flexibility and problem solving in a new context: post-hoc analyses of the components of behavioral flexibility” by Lukas et al. This manuscript is the third emerging from a three-way split of a previous large manuscript that had an in-principle preregistration acceptance. Contrary to the other two and as indicated in its title, it is however entirely relying on non-preregistered data analyses, and as such may not benefit a priori from that in-principle preregistration acceptance.
I have mixed feelings about this manuscript. On the one hand, the authors root their analysis in a wish to bring more principled analysis methods to behavioural data, explicitly grounded in preexisting theoretical research, which hopefully should lead to more interpretable and transferable results. The theoretical model they root their manuscript on is relatively clearly presented, and seems appropriate (from an external but quantitatively-minded viewpoint). However, the authors also consistently underdescribe the protocols, data, and results, which make the manuscript difficult to parse for anyone who hasn’t read the first Logan et al. preprint immediately before (or in some cases, the original preregistration). They also seem to either make some mistakes in the implementation of the analysis, and/or fail to accurately explain what they did in the manuscript. While I did read the attached code, I note that it is not always easy to decide which of these two alternatives it is from it.
Reply 1.0: Thank you for your continuing constructive and insightful feedback. Based on the comments, we realized that by simply moving previous post-hoc analyses from the longer manuscript we did not provide sufficient focus and explanations for the research presented here. In light of this, we have now completely reframed and restructured the article.
Please find below my detailed point-by-point comments:
COMMENT 1.1: First paragraph of the Introduction: I am sceptical of the choice to frame the introduction of the paper so heavily around the replicability crisis. On the one hand, yes the study was preregistered, and indeed theory-minded models as the ones used here are a way to increase interpretability of, and confidence in research results. On the other hand, this entire paper is a non-preregistered post-hoc re-analysis (a series of such analyses actually), and of a dataset with a relatively small sample size. These are some of the exact issues that have been (with different levels of justification) involved in the so-called replicability crisis.
I would advise not to rely too much on that framing, or at least not that generally/broadly. The narrower idea that analyses of behavioural data may be more meaningful/interpretable/transferrable if they rely on models explicitly rooted in theory, rather than general-purpose “ready-to-wear” statistical analyses (“heliocentric” vs “geocentric” models, to keep (McElreath, 2020)‘s analogy), is a sound one though.
Reply 1.1: We agree that the previous framing did not target what this article could and could not achieve. We have now reframed the article to focus on the benefit of applying and modifying Bayesian reinforcement models to serial reversal learning tasks, linking this to the specific analyses that are being presented. We agree that this avoids confusion, helps to bring in relevant literature, and clarifies the interpretation of the result. We have changed the title, abstract, introduction, research questions, and discussion accordingly.
COMMENT 1.2: There is a number of elements in the Methods description that at best require large amounts of clarifications, and at worse to re-do or remove entire analyses:
2A: The aims and design of the simulation analysis (Methods “1) Using simulations to check models …” ) are very unclear. Is it (a) to determine the contributions of phi and lambda to learning variation in general? (b) the specific grackle dataset? (c) In the statistical population from which these grackles originate?
From reading the comments in the attached code (!) it actually appears to be “none of the above: it seems that the aims of that part of the study is to test whether the theory-minded model is able to recover the parameter values used to generate the simulated data that were used for the power analysis, back during the preregistration. Except that either (i) the simulated data were generated using that theory-minded model, and in that case checking that this matches is not a research question per se, but a prerequisite to the actual analysis and a sense check, or (ii) the simulations were generated using a different process, and in that case there might be something interesting to compare. However, it is very unclear from the manuscript what that is. I invite the authors to carefully reconsider whether that simulation brings anything to the manuscript.
Reply 1.2: We added specific research questions with explanations of their rationale and predictions for each of the different analyses we present. The simulations were initially set up as as part of a different preregistration, where they served to estimate power for a population comparison. We re-used the simulations here for a different purpose. For the simulations, we now explain that our aim is to determine whether (1) Bayesian reinforcement learning models can be used to detect changes in behavioral flexibility during an experiment, as previous studies have only inferred single static assessments of individuals; and (2) what behavior we should expect in the specific experiment we analyzed for the grackles, as these models previously were used to make general predictions or inferences. We added the following two research questions, and use this framing also for the methods, results, and discussion:
“1) Are the Bayesian reinforcement learning models sufficiently sensitive to detect changes that occur across the limited number of serial reversals that individuals participated in?
The models infer two parameters, the association updating rate $\phi$ and the sensitivity to learned associations $\lambda$, from the behavior of individuals, from across the traditional single outcome, the number of trials needed to reach the criterion. In theory, multiple combinations of the two parameters could lead to the same number of trials during a given reversal. Whether information from a single or few reversals is sufficient to infer these values for individuals at different time points throughout a serial reversal experiment has not been systematically addressed before, so we used simulations to assess whether these models work on the samples that people usually work with. Determining the minimum number of choices per individual necessary to correctly infer their underlying parameters is necessary to reveal the dynamic changes in these parameters as individuals adjust their expectation of change throughout the serial reversal learning experiments and react accordingly.
Prediction 1: We predicted that the Bayesian reinforcement learning model can reliably infer the two parameters based on the choices individuals make during reversal learning, and that it can detect changes in these parameters that might occur during the series of reversals that individuals usually experience (4-6 reversals).
2) Is a strategy of high association-updating ($\phi$) and low sensitivity to learned associations ($\lambda$) best to reduce errors in the serial learning experiment?
Previous modeling work predicts that in situations in which changes are abrupt, but information is reliable, individuals learning in accordance with a Bayesian reinforcement model should show a high association-updating rate and a low sensitivity to learned associations (Dunlap & Stevens 2009, Breen & Deffner 2023). The modeled situations were however abstract and the inferred optimal association updating rates and sensitivities higher than what is usually observed in reversal learning experiments. We therefore perform simulations of the specific behavior exhibited in serial reversal learning experiments to assess how changes in the choices individuals make link to their $\phi$ and $\lambda$ values. In addition, previous studies were only focused on the optimal values for the two parameters in different situations rather than looking at how $\phi$ and $\lambda$ interact to explain variation among individuals. We therefore also use the simulations to determine whether one of the two parameters $\phi$ and $\lambda$ might explain more of the variation in the number of trials individuals need to reach the criterion of choosing the correct option 17 out of 20 times during a reversal.
Prediction 2: We predicted that both $\phi$ and $\lambda$ influence the performance of individuals in a reversal learning task, with higher $\phi$ values (faster learning with a higher association-updating rate) and lower $\lambda$ values (more exploration with less sensitivity to learned associations) leading to individuals more quickly reaching the passing criterion after a reversal in the color of the rewarded option.”
COMMENT 1.3: In addition, I note that the authors analyse the simulated data (number of trials to reverse) assuming a Gaussian likelihood (line 178), where these are count data (probably more suited to Poisson/Negative-Binomial). As mentioned again and again in earlier reviews, this may or may not influence the interpretation in the end, but you can’t be sure without checking the data meet the likelihood’s assumptions.
Reply 1.3: Thank you for highlighting that the number of trials to reach the criterion during the reversal needed a different likelihood. The models in which we attempt to explain variation in the number of trials are now constructed assuming a Poisson distribution, with a log-likelihood link, which we explain in the Methods:
“We assumed that the number of trials followed a Poisson distribution, because the number of trials to reach criterion is a count that is bounded at smaller numbers (individuals will need at least 20 trials to reach the criterion), with a log-linear link, because we expect there are diminishing influences of further increases in $\phi$ or $\lambda$.”
This did not, overall, change any of the previous associations, but makes the inferences more precise.
COMMENT 1.4: Most if not all the analyses are done in a Bayesian framework using Stan. Yet the authors do not give key details that should be provided with any such analyses, such as: the priors and why they were chosen; how did they check convergence and how; did they run posterior predictive checks… All of these have the potential to affect the validity of the inference (Gelman et al., 2020; McElreath, 2020); thus information on how they were done is needed. In particular, cursory reading of the code signals that priors were altered from the original choices: then, some explanation is needed either a minima to explain the final prior choice, a maxima to explain the initial priors, why they were bad, and why the final choice is better (I am in principle OK with the a minima option)
Reply 1.4: We realized that we had not provided sufficient information on all of the model formulation and their estimation. For all statistical models, we added the specific formulas linking the outcome to the predictor variables, the priors, and the rationale for choosing particular priors. In all instances priors were informed by previous data from a different population or by the predictions. Here is the example for the model investigating the number of trials in relation to phi and lambda in the Methods:
“Number of trials to reverse ~ Poisson(mu)
log mu = a + b*phi + c*lambda
a ~ Normal(4.5,1)
b ~ Normal(0,1)
c ~ Normal(0,1)
The prior for the intercept a was based on the average number of trials birds in Santa Barbara were observed to need to reach the criterion during the reversal (mean of 4.5 is equal to logarithm of 90, standard deviation set to 1 to constrain the estimate to the range observed across individuals). The priors for the relationships with $\phi$ and $\lambda$ were centered on zero, indicating that a-priori we do not bias it toward either a positive or a negative relationship.”
We also added more general information about how we estimated these statistical models in the Bayesian framework in the Methods:
“This, and all following statistical models, were implemented using functions of the package ‘rethinking’ (McElreath 2020) in R to estimate the association with stan. Following the social convention set in (McElreath 2020), we report the mean estimate and the 89% confidence interval from the posterior estimate from these models. For each model, we ran four chains with 10,000 iterations each (half of which burn-in, half samples for the posterior). We checked that the number of effective samples was sufficiently high and evenly distributed across parameters such that auto-correlation did not influence the estimates. We also confirmed that in all cases the Gelman-Rubin convergence diagnostic, Ȓ, was 1.01 or smaller indicating that the chains had converged on the final estimates. In all cases, we also linked the model inferences back to the distribution of the raw data to confirm that the estimated predictions matched the observed patterns.”
COMMENT 1.5: the models used to estimate phi and lambda from the observed bird data are severely underdescribed (“2) Estimating 𝜙 and 𝜆 from the observed …”). In addition to all the issues in 2B: what is the likelihood (one could assume Normal, but see comment 2A)? Was one model fitted per bird, or was an overall mixed model fixed for all birds, with bird-specific random effects for phi and lambda (the code suggests the latter, as should be)? Was the correlation between phi and lambda at the bird level modelled explicitly or estimated later? When the authors say that were estimated separately for the beginning and the end of the experiment, is that “separate” as in “2 separate models”, or “separate” as in “we added a beginning/end factor effect”? Same for control vs manipulated? Why only use the first 2 and final 2 trials, and not the entire sequence? All of these questions need some form of answer in the manuscript, to be able to pass any judgment on the validity of the Results. Some of these answers seem to be in the attached code; they should also be in the manuscript.
Reply 1.5: We expanded the section about the implementation and estimation of the Bayesian reinforcement model. We fit an overall model with individual-specific random effects for phi and lambda. We provide additional detail about the model in the Methods:
“We implemented the Bayesian reinforcement learning model in the statistical language Stan [Stan Development Team 2020], calling the model and analyzing its output in R. The model takes the full series of choices individuals make (which of the two options did they choose, which option was rewarded, did they make the correct choice) across all their trials to find the $\phi$ and $\lambda$ values that best fit these choices given the two equations: whether or not individuals chose the rewarded option was reflected as a categorical likelihood (yes or no) with probability P as estimated from equation 2, before updating the associations using equation 1. The model was fit across all choices, with individual $\phi$ and $\lambda$ values estimated as varying effects. In the model, $\phi$ is estimated on the logit-scale to force the values to be positive before being converted back for equation 1 to update the associations, and $\lambda$ is estimated on the log-scale to account for the exponentiation that occurs in equation 2. We set the priors for both to come from a normal distribution with a mean of zero and a standard deviation of one. We set the initial associations with both options for all individuals at the beginning of the experiment to 0.1 to indicate that they do not have an initial preference for either option but are likely to be somewhat curious about exploring the tubes because they previously underwent habituation to food in tubes with a differently colored tube (see below). For estimations at the end of the serial reversal learning experiment, we set the association with the option that was rewarded before the switch to 0.7 and the option that was previously not rewarded to 0.1.”
This model was fit to different subsets of the data. We used the simulations to determine the minimum sample required to accurately estimate an individual’s phi and lambda. This turned out to be two phases, across one switch. This is why, for the grackles, we used the trials from the first two phases (initial discrimination and reversal one) to estimate their behavioral flexibility at the beginning, and from their final two phases (their last two reversals) to estimate their behavioral flexibility at the end. Our research question now details why we are interested in the dynamic changes between these two phases (beginning vs end) rather than the entire sequence. In the methods, we now detail the different subsets of data that the model was applied to:
“We fit the Bayesian reinforcement learning model to the data of both the control and the manipulated grackles. Based on the simulation results indicating that the minimum sample required for accurate estimation are two learning phases across one switch (see below), we fit the model first to only the choices from the initial association learning phase and the first reversal learning phase for both control and manipulated individuals. For the control birds, these estimated $\phi$ and $\lambda$ values also reflect their behavioral flexibility at the end of the reversal learning experiment. For the manipulated grackles, we additionally calculated $\phi$ and $\lambda$ separately for their final two reversals at the end of the manipulation to infer the potential changes in the parameters.”
COMMENT 1.6: The third part of the analysis described in Methods is “3) Linking 𝜙 and 𝜆 from the observed serial reversal learning performances to the performance on the multi-access boxes”. It relies on using phi and lambda estimated from reversal trials to explain performance in the multi-access boxes. There is however a fundamental and potentially breaking issue here, based on the text provided: the authors seem to ignore uncertainty in the estimated phi and lambda. See “The values for 𝜙 and 𝜆 for each individual are estimated as the mean from 2000 samples from the posterior” (line 158), which is not contradicted by anything later on, and seems to be consistent with the code attached. It is well-known (see e.g. Houslay & Wilson, 2017 for a discussion in the context of behavioural syndromes), that this kind of “statistics-on-statistics” where error is ignored can lead to anticonservative analyses and wrong inferences, by inflating the degree of certainty we have about the underlying data points (here the phis and lambdas). Given individual estimated lambda and phi are going to be quite uncertain, given the limited data, this may likely be a very strong issue here.
Several options are available to accurately propagate uncertainty in phi and lambda. I present 3 below, but these are just the ones I am familiar with; other may be available:
- using a multivariate model combining the analyses in Methods 2) and Methods 3) in one single model, in which the phi and lambda act as the link between reversal and multi-box performance.
- Use measurement error models (see chapter 15 in (McElreath, 2020))
- Fit the model N times, one per posterior sample from the distribution of phis and lambdas obtained in Methods 2) and combine the posteriors. See (Nakagawa & De Villemereuil, 2019) for an application in the context of phylogenetic uncertainty. This has links to multiple imputation methods (https://cran.r-project.org/web/packages/brms/vignettes/brms_missings.html)
Reply 1.6: We had perceived the Bayesian reinforcement learning model as a mechanistic model rather than a statistical model, which is why previously had performed the further analyses with the single estimates. Your comment though correctly points out that, with a mechanistic model, there is uncertainty in the estimates. We now integrate this uncertainty with the approach you outline as option 3, repeating the subsequent analyses across samples from the posterior. The estimated phi and lambda values are predictor, not outcome variables, which is why the measurement error model does not appear appropriate in this case. For efficiency, we split the estimation of phi and lambda from the further models instead of each time reestimating phi and lambda repeatedly. We now explain this in the Methods:
“We used functions of the package ‘posterior’ [@vehtari2021rank] to draw 4000 samples from the posterior (the default in the functions). We report the estimates for $\phi$ and $\lambda$ for each individual (simulated or grackle) as the mean from these samples from the posterior. For the subsequent analyses where the estimated $\phi$ and $\lambda$ values were response or predictor variables, we ran the analyses both with the single mean per individual as well as looping over the full 4000 samples from the posterior to reflect the uncertainty in the estimates. The analyses with the samples from the posterior provided the same estimates as the analyses with the single mean values, though with larger confidence estimates because of the increased uncertainty. In the results, we report the estimates from the analyses with the mean values, the estimates with the samples from the posterior can be found in the code in the .rmd file at the repository. In analyses where $\phi$ and $\lambda$ are predictor variables, we standardized the values that went into each analyses (either the means, or the respective samples from the posterior) by subtracting the average from each value and then dividing by the standard deviation. We did this to define the priors for the relationship on a more standard scale and to be able to more directly compare their respective influence on the outcome variable.”
COMMENT 1.7: (Importantly, that issue about accurately conveying uncertainty also influences Figures 1,3 and potentially 2. Without information about posterior distribution, there is no way to know if any of the points/boxes on any of the panels are actually that different from each other, and thus no meaning to gain from the figure)
Reply 1.7: We changed Figures 1 and 7 to reflect this uncertainty in the estimates. We decided not to add this to the now Figure 4 (previous Figure 3) because we think it will make the figure too busy and confusing, especially given that the analyses with the samples from the posterior did not change any of the statistical associations we describe in that figure.
COMMENT 1.8: Line 216: The authors mention that phi and lambda are correlated. Did they consider the implications of this correlation (potential collinearity issues) when they included both in the models to explain multi-box performance?
Reply 1.8: In the discussion, we now interpret the relationships between the performance on the multi-access boxes and phi and lambda as potentially being caused by an interaction between the two parameters that lead to different strategies:
“We did detect U-shaped relationships between $\phi$ and $\lambda$ and how individuals performed on the multi-access boxes. First, grackles with intermediate $\phi$ values showed shorter latencies to attempt a new locus. This could reflect that grackles with high $\phi$ values take longer because they formed very strong associations with the previously rewarded locus, while grackles with small $\phi$ values take longer because they do not update their associations even though the first locus is no longer rewarded or because they do not explore as much because of their small $\lambda$. Second, we found that grackles with intermediate values of $\lambda$ solved fewer loci. This could indicate that grackles with a small $\lambda$ are more likely to explore new loci while grackles with a large $\lambda$, and low $\phi$ are less likely to return to an option that is no longer rewarded. Given that there was also a positive correlation between number of loci solved and the latency to attempt a new locus, there might be a trade off, where grackles with extreme $\phi$ and $\lambda$ values solve more loci, but need more time, whereas grackles with intermediate values have shorter latencies, but solve fewer loci. We are limited though in our interpretation by the small sample sizes. More detailed studies would be needed to fully understand how the association-updating rate and the sensitivity to learned associations might shape the performance on the multi-access boxes.”
COMMENT 1.9: I am also slightly worried about a comment in the linked code: “ line 473# Try different priors to reduce the correlation between estimated phis and lambdas”. If phis and lambdas really do have an interpretable biological meaning and do reflect two components of behavioural flexibility, it is also perfectly possible and natural for them to really be correlated.
Reply 1.9: This comment was a remnant from the estimation of phi and lambda from the simulated data. In the simulated data, we know that phi and lambda are not correlated because we assigned all possible combinations of phi and lambda to the individuals. We noticed the negative correlation in the estimations from a single phase (just initial association learning or just first reversal phase). We wanted to see whether we could reduce the correlated shift in the two estimated values. However, we realized that this would not be possible because multiple combinations of values could lead to the same series of choices during a single phase, and that the additional information of how individuals behave after a switch is needed to infer the correct values for phi and lambda.
COMMENT 1.10: Continuing on the description of the multi-access data analysis: the mathematical description of the models (lines 224-227 and 233-237) are welcome, but they obfuscate what was done for most readers.
Consider that it is much clearer for the average reader, and just as accurate to simply write: “we fit a binomial* GLM(M) (logit** link) explaining the number of loci/4*** each individual solved in the multiaccess task by their phi and lambda estimated from the reversal learning data.” [replace by *negative-binomial, **log link, ***latency respectively for the 2nd model]. The exact math formulas can be given as supplementary material, including the prior specifications if the models were fitted in a Bayesian framework (which is unclear here).
Reply 1.10: We did fit these models in a Bayesian framework. We therefore decided to keep the mathematical description in the method section rather than moving them to the supplement. As mentioned above (Reply 1.4), we now provide more detailed information on all the statistical models (see also below Reply 1.5).
COMMENT 1.11: What is the rationale for using absolute deviations from the median phi/lambda? Why not the usual ways to test for non-linear and especially U-shaped relationships, such as quadratic terms for instance? Assuming the mention of using “ squared phi/lambda” refers to quadratic terms, (a) why not use only those as they are standard? (b) from the text the authors imply these models included only phi^2 and lambda^2 as explanatory variables, rather than phi, phi^2, lambda and lambda^2?
Reply 1.11: We had fit the previous models with the absolute deviations because we were not sure whether the relationship would exist just because of extreme values. With the revised framework, and the clearer analyses for why phi and lambda would be negatively correlated at the end of the serial reversal learning experiment and why these different strategies grackles develop could also affect their performance on the multi-access boxes (see for example new figure 6), we realize that the proposed approach of adding quadratic terms is more appropriate. We therefore fit a single model for each of the four outcomes (latency to approach new locus and number of loci solved on both the plastic and the wooden multi-access boxes) with the predictor variables phi, phi squared, lambda, and lambda squared:
“With our observation that $\phi$ and $\lambda$ could be negatively correlated (see results), we realized that grackles might be using different strategies when facing a situation in which cues change: some grackles might quickly discard previous information and rely on what they just experienced (high $\phi$ and low $\lambda$), or they might rely on earlier information and continue to explore other options (low $\phi$ and high $\lambda$). Accordingly, we assumed that there also might be non-linear, U-shaped relationships between $\phi$ and/or $\lambda$ and the performance on the multi-access box.
For the number of loci solved, we fit a binomial model with a logit link:
locisolved ~ Binomial(4, p)
logit(p) ~ a[batch] + b * $\phi$ + c * $\phi$^2 + d * $\lambda$ + e * $\lambda$^2
a ~ dnorm(1, 1)
b ~ dnorm(0, 1)
c ~ dnorm(0, 1)
d ~ dnorm(0, 1)
e ~ dnorm(0, 1)
locisolved is the number of loci solved on the multi-access box, 4 is the total number of loci on the multi-access box, p is the probability of solving any one locus across the whole experiment, α is the intercept and each batch gets its own, b is the expected linear amount of change in locisolved for every one unit change in $\phi$ in the reversal learning experiments, c is the expected non-linear amount of change in locisolved for every one unit change in $\phi$ squared, d the expected linear amount of change for changes in $\lambda$, and e the expected non-linear amount of change for changes in $\lambda$ squared.”
COMMENT 1.12: There is a very large number of models provided in results (see Tables). This doesn’t match the Methods at all. From the methods as written (excluding the simulated data) there are only 3 basic models implied:
1-Estimating phi and lambda from reversal data (there may be more than one model here, see COMMENT 2C, but this can and arguably should be done in one model for all birds);
2 – locisolved in the multi-access test ~phi+lambda
3 – latency to solve the multi-access test ~phi+lambda
2 and 3 can of course be declined in several flavours based on whether you use linear/quadratic effects of phi or lambda (see COMMENT 5), but this doesn’t add up to the 40+ models presented. From what I understand, a large part of these models are reanalyses of the ones in Logan et al. I have several comments here:
are these models still in the new version of Logan et al? do they actually need to be reanalysed to make your point?
If yes to any of these questions, why are they not described in more details? I would argue there are no way for the average intended reader to understand what each model in the Tables refers to (I cannot guarantee I do, despite having covered most of the review history of this project).
I strongly suggest the authors streamline their analyses to only include the 3 basic models I describe above (with the variations I also describe being possible). Alternately, the authors may want to include descriptions and rationale for each and every model they include in their Tables. In any case, including so many models without clear description or rationale, in a preprint that starts by a paragraph about the reproducibility crisis, is bound to attract judgment (see COMMENT 1)
Reply 1.12: We have restricted our analyses to fit the models to the specific research questions outlined in the introduction. For the grackle data, this includes the four models for the multi-access boxes (described in Reply 1.5), the models that link phi and lambda to the number of trials needed to reach criterion, the models describing how phi and lambda changed from the beginning to the end of the serial reversal learning experiment, and models determining whether how grackles changed during the experiment could be predicted by their attributes at the beginning. We now report the results from these models directly in the relevant sections of the results, and no longer include the table summarizing models.
COMMENT 1.13: My comment about the validity of the now-Figure 4, from the original preprint, still stands: That figure implies causal links between the different items. And my criticisms about the underlying models (COMMENT 6) notwithstanding, it is clear that these models were not chosen based on a causal framework (from the number of models in Tables alone, but also from the text of the manuscript). I again repeat my advice to remove that figure, which is of no benefit for the manuscript, or to recontextualize it clearly.
Reply 1.13: We agree that this figure was based on a post-hoc attempt to interpret a series of complicated interactions without clear predictions, and have removed the figure as well as the respective analyses and their discussion.
COMMENT 1.14: Following on COMMENT 2D, figure 5 should include measures of lambda and phi uncertainty to be informative
Reply 1.14: We have added an indication of the uncertainty in the estimates of lambda and phi to Figure 7 (previous Figure 5).
MINOR COMMENTS:
COMMENT 1.15: The title as it stands is not informative on the content of the article, but only refers to a previous article.
Reply 1.15: With the reframing, we have adapted the title accordingly. We agree that this manuscript should stand on its own, rather than just referring to some post-hoc analyses.
“Bayesian reinforcement learning models reveal how great-tailed grackles improve their behavioral flexibility in serial reversal learning experiments”
COMMENT 1.16: Abstract, lines 23-24: “flexibility” is repeated twice in one sentence
Reply 1.16: We have rewritten the abstract and removed this sentence.
COMMENT 1.17: Line 24-27 (and throughout the manuscript): the results of Logan et al are presented here in a very affirmative, general and certain way. Please remember that that paper is still under review and to adjust the language around it accordingly during revisions, especially since comments about the limited sample size and its impact on the generalisability of conclusions have been made repeatedly.
Reply 1.17: The original article presenting the data and findings we further analyze here has now been published after peer review. Given the limited sample sizes though, we have formulated the conclusions in less affirmative way:
“After the reversal learning experiment, both the manipulated and the control grackles were given a different flexibility test using multi-access boxes. Grackles who experienced the serial reversal learning experiment subsequently also appeared to show improved behavioral flexibility in this different context as they required less time to switch to a new option when the previous one was blocked and solved a larger number of the four problems presented in the multi-access boxes [Logan et al. 2023].”
COMMENT 1.18: Line 51: As in the previous 2 manuscripts, the authors consistently assume the reader knows discipline-specific definitions, and either don’t present them, or present them too late/implicitly/as an afterthought. This is the case here for “behavioural flexibility”
Reply 1.18: With the new framing, we now introduce behavioral flexibility in the first paragraph:
“Most animals live in environments that undergo changes which can affect key components of their lives, such as where to find food or which areas are safe. Accordingly, individuals are expected to be able to react to these changes. One of the ways in which animals react to changes is through behavioral flexibility, the ability to change behavior when circumstances change (Mikhalevich et al. 2017).”
COMMENT 1.19: Throughout the manuscript, the authors cannot seem to agree whether to write “phi” and “lambda” or 𝜙 and 𝜆, sometimes alternating between Latin and Greek notation in a single paragraph.
Reply 1.19: We have now consistently switched the notation to the Greek letters 𝜙 and 𝜆, except for when we first introduce and define these terms:
“The first process reflects the learning about the environment, through updating associations between external cues and potential rewards (or dangers). Individuals are expected to show different rates of updating associations (which we refer to as 𝜙, the greek letter phi, in the following) in different environments, with lower rates when changes are rare and associations are not perfect such that a single absence of a reward might be an error rather than indicating a new association, and higher rates when changes are frequent and associations are reliable such that individuals should update their associations when they encounter new information (Dunlap & Stevens 2009, Breen & Deffner 2023). The second process reflects how individuals, when presented with a set of cues, might decide between these alternative options based on their learned associations of the cues. Individuals with larger sensitivity to their learned associations (which we refer to as 𝜆, the greek letter lambda, in the following) will quickly prefer the option that previously gave them the highest reward (or the lowest danger), while individuals with low sensitivity will continue to explore alternative options.”
COMMENT 1.20: Comments about formatting that go back to the original manuscript have still not been taken into account. For instance, in Tables, there are many cases of missing spaces, missing colons, similar terms alternating between capitalized or not with no reason. The presentation of model terms does not make the table easy to read (no separation between lines referring to different models). One could also argue that “n_eff” should be directly written as “effective sample size” in the table, and that rather than writing “Rhat”, one should write in the actual “Rhat” symbol
Reply 1.20: We have removed the tables and now report the statistical outputs directly in the results text.
COMMENT 1.21: The citation for Stan is wrong: "(Team et al 2019)"(line 156); S.D. Team is not an author name; it should be Stan Development Team. This comments adds to my repeated comments here and in previous reviews about checking for correct formatting .
Reply 1.21: Thank you for checking this. We had not double checked the bibtex entries before automatically generating the reference list. We have now corrected this.
COMMENT 1.22: The combined code for the analysis and manuscript is extremely long and dense, which makes it hard to parse. I would strongly to suggest to split it, first into manuscript code and analysis code (remember that you can always split a code in parts, and source() the code of a part into another, to make the latter shorter and easier to read), and then into sub-analysis code files. I acknowledge that it would be a daunting amount of work, so only suggest it. I note that the authors implicitly already do that splitting themselves, since they repeatedly re-call libraries and datasets at the start of each “chapter” of the code.
Reply 1.22: We have rewritten the code to match the new structure of the manuscript. There is now one code section for each of the 6 sections in the results. Each code section is independent, with respective libraries being called and data loaded at the beginning of each section. We decided to leave them in the rmd file rather than generating separate files that are being sourced so readers can more directly link analyses to respective results. Given that the PDF version at EcoEvoRxiv does not include the code, we decided to leave the code in the rmd file.
REFERENCES
Gelman, A., Vehtari, A., Simpson, D., Margossian, C. C., Carpenter, B., Yao, Y., Kennedy, L., Gabry, J., Bürkner, P.-C., & Modrák, M. (2020). Bayesian workflow. ArXiv. http://arxiv.org/abs/2011.01808
Houslay, T. M., & Wilson, A. J. (2017). Avoiding the misuse of BLUP in behavioural ecology. Behavioral Ecology, 28(4), Article 4. https://doi.org/10.1093/beheco/arx023
McElreath, R. (2020). Statistical rethinking: A Bayesian course with examples in R and Stan (2nd edition). Chapman and Hall/CRC.
Nakagawa, S., & De Villemereuil, P. (2019). A General Method for Simultaneously Accounting for Phylogenetic and Species Sampling Uncertainty via Rubin’s Rules in Comparative Analysis. Systematic Biology, 68(4), 632–641. https://doi.org/10.1093/sysbio/syy089
Reviewer #2 (anonymous)
Dear Editor and Authors,
I reviewed the paper “Behavioral flexibility is manipulatable and it improves flexibility and problem solving in a new context: post-hoc analyses of the components of behavioral flexbility” by Lukas et al, submitted to Peer Community in Ecology.
Behavioural flexibility is central to understanding the importance of cognition in animal evolution. Among the many learning pathways, individual associative learning may be the backbone of some of the most sophisticated behaviours (see publications by Johan Lind et al. - “Can associative learning be the general process for intelligent behavior in non-human animals?” and “What can associative learning do for planning?”, for a demonstration). An interesting question in this regard is to understand how animals are able to balance previously constructed associations (i.e. knowledge) with currently experienced situations (i.e. cues), and how this affects the ability of individuals in different contexts. In this paper, the authors bring an interesting perspective to this question, by not only linking behavioural flexibility to individual performance, but by trying to understand the mechanism by which such a link is made. In particular, they distinguish between the tendency to stick to previous experience and the tendency to explore new possibilities as constraints/drivers of behavioural flexibility and performance in solving cognitive tasks.
I found this article very interesting, especially in its methodological approach. It necessarily suffers from a small sample size (as is the case with many studies of animal behaviour, and which I would not comment, for authors have tackled the statistical power of their design in previous publications, and the sampling effort was already considerable!). I have also raised a few subsequent points that I would like to discuss. Specifically, the authors have tried to be as transparent as possible in their scientific approach (pre-submission paper, availability of data, etc.), but I fear that this has reached a level that detracts from the understanding of the article. I have therefore suggested ways in which the article can be a fully self-contained article, thereby improving clarity. In addition, careful editing for typos and consistency of writing is necessary, especially if the article is submitted to PCI journal that does not have editing. Overall, however, I find this to be a very nice illustration of the value of mechanistic modelling in elucidating the causalities linking animal cognition, observed behaviours and animal success (even if it is still correlation in the end). To help improve the manuscript, I have divided my comments into two main categories, each ordered according to the structure of the main text (abstract, introduction, etc.). The first (Comments on content) is devoted to improving the substance of the article, covering issues ranging from the readability of the article to methodological concerns. A second part (Comments on the form) is devoted to minor aspects, such as typos, the arrangement of equations or figures, or the flow of the text. As I am not a native English speaker myself, my proposed editing of the text is only intended to improve clarity and to be more concise. I trust the authors more than myself to make the text accurate in English if what I have suggested was not. Finally, although my work focuses on animal cognition, I base my studies on behavioural observations in nature, not on experiments. Therefore, I cannot firmly evaluate the experimental protocol, which has however already been peer-reviewed at the pre-submission stage.
Although I have highlighted the weaknesses of the paper that I have identified, I do not want this to overshadow the many qualities that the document also has,
I hope that these comments will nevertheless be appreciated by the authors.
Sincerely.
Reply 2.0: Thank you for your helpful and detailed feedback. Your suggestions helped with the framing of the article, in particular around the different forms of uncertainty and change that individuals might have to respond to and how this can influence their learning and behavioral flexibility.
Comments on content
COMMENT 2.1: Title: I understand that these are follow-up analyses to previous work, but the authors might consider a more “stand-alone” title. Indeed, it shows new (but complementary) results to previous publications. Therefore, the authors could consider giving a title that explicitly states the results of these analyses, and only state at the end of the introduction that this can be considered as a follow-up analysis to Logan et al. (2022).
Reply 2.1: With the new frame and structure, we have changed the title to reflect the specific research presented in this article:
“Bayesian reinforcement learning models reveal how great-tailed grackles improve their behavioral flexibility in serial reversal learning experiments.”
COMMENT 2.2: Abstract: I am afraid that, in my opinion and in its current state, the abstract needs to be rewritten, especially to make it accessible to neophytes who are unaware of the experimental set-up put in place by the research team. In particular:
• The initial sentence is, in my opinion, still too similar to what has already been published by the team (Blaisdell et al., 2021), and has lost some precision along the way (e.g. flexibility is not associated with adaptation to a new environment per se, which I currently understand. Moreover, flexibility can also be deleterious if it is ‘blind’).
Many terms are at this stage unclear to the reader (context/multiple access box, the “components” of behavioural flexibility - not performance, I suppose - which I am not sure refer to what is stated afterwards without having read the whole document, locus/loci).
L25-26, the authors might consider subcategorising the “flexibility” they are studying, as there is no “one behaviour” and therefore no one “behavioural flexibility”. In particular, the authors are working in the context of associative learning during foraging, and it might be important to make this clear (this could be also true in the introduction).
L30-31 “This result was supported in simulations”. Are the authors referring to the model test? If so, I would suggest that the authors do not state it in this way, as the simulations were only done to evaluate the methodological approach. The authors may only write that “this result was supported by cognitive experiments on wild grackles”.
The summary lacks a broader perspective outside the world of grackles. Perhaps the author could consider adding a sentence about how the work may fit into theories around behavioural flexibility (even if this is only speculation, provided it is clearly stated).
Overall (and like the rest of the paper), the authors might consider presenting the text as a stand-alone article. This could be done by not systematically referring to the results of the previous experiments (or by linking to the previous publications without giving a ‘short’ summary), although the authors could consider this study as a post-hoc analysis. I think this would reinforce the ideas that are put forward by this paper and that are really distinct from their previous work.
Reply 2.2: We have now reframed the article to stand alone. The feedback helped us move this article from being a description of post-hoc analyses to having a clear framework with specific research questions. We have rephrased the abstract accordingly, paying attention to explain terms and experiments that might not be familiar to a more general audience.
“Environments can change suddenly and unpredictably, so animals might benefit from being able to flexibly adapt their behavior through learning new associations. Reversal learning experiments, where individuals initially learn that a reward is associated with one of the presented options before the reward is switched to another option forcing individuals to reverse their learned associations, have long been used to investigate differences in behavioral flexibility among individuals and species. Here, we apply and expand newly developed Bayesian reinforcement learning models to gain additional insights into how individuals might adapt their behavioral flexibility in response to the changes they experience during reversal learning experiments. Using data from simulations and great tailed grackles (Quiscalus mexicanus), we find that two parameters, the association updating rate reflecting how much individuals weigh the most recent information relative to previously learned associations and the sensitivity to learned associations reflecting whether individuals no longer explore alternative options after having formed associations, are sufficient to explain the different strategies individuals display during the experiment. Individuals gain rewards more consistently if they have a higher association updating rate, because they learned that cues are reliable and they therefore can gain the reward consistently during one phase. The sensitivities to learned associations plays a role for the grackles who experienced a series of reversals, where individuals with lower sensitivities are better able to explore the alternative option after a switch. The grackles who experienced the serial reversal adapted their behavioral flexibility, with some individuals being proficient because they explore more such that they can quickly change to the alternative option after a switch even if they continue to occasionally choose the unrewarded option, while others stick to the learned associations such that they take longer to change after a switch but once they have reversed their associations consistently choose the correct option. These strategies the grackles exhibited at the end of the reversal learning experiment also influence their performance on puzzle boxes where different ways to access rewards are sometimes available. Grackles with intermediate strategies solved fewer ways to access rewards that grackles with either of the extreme strategies, but they took longer to attempt a new way. Our approach offers new insights into how individuals react to uncertainty and changes in their environment, in particular showing that they can adapt their behavioral flexibility in response to their experiences.”
COMMENT 2.3 Introduction
To me, the definition of φ as “rate of learning” is at odds with equation 1. Instead, equation 1 describes what is called “irrationality”, i.e. the tendency to rely on long-term knowledge (low φ) rather than on recent signals. Perhaps the authors could opt for another name to avoid this confusion.
I don’t understand what it means that “individuals act on small differences in their attraction”. In particular, beyond the meaning itself, I also don’t understand how this refers to λ. Can the authors think of a way to make this clearer?
L70 “less attractive”, the authors might consider specifying “perceived as less attractive”, as this depends on the individual’s knowledge, right?
L73 At this stage, a naive reader (as I was) may not understand why it is about the “both” options, as the experimental setting was not yet detailed. The authors may
therefore consider rewording.
• L75, the authors give examples of φ values. However, it has not been defined that it is between 0 and 1 (which is only understood later from equation 1).
May I ask why λ is considered a rate, since with equation 2, it seems that there is no constraint on its values, which are therefore not between 0 and 1.
Reply 2.3: We have changed the labels for both φ and λ, and expanded on their definitions in the introduction. We previously tried to match the labels to what other people had been using, but now realized that it is more helpful to use labels that express more directly what is relevant here. We refer to φ as the association-updating rate and λ as the sensitivities to learned associations. In addition, with the new frame, we now in the introduction explain how these two parameters are assumed to shape the behavior of individuals:
“The first process reflects the learning about the environment, through updating associations between external cues and potential rewards (or dangers). Individuals are expected to show different rates of updating associations (which we refer to as $\phi$, the greek letter phi, in the following) in different environments, with lower rates when changes are rare and associations are not perfect such that a single absence of a reward might be an error rather than indicating a new association, and higher rates when changes are frequent and associations are reliable such that individuals should update their associations when they encounter new information (Dunlap & Stevens 2009, Breen & Deffner 2023). The second process reflects how individuals, when presented with a set of cues, might decide between these alternative options based on their learned associations of the cues. Individuals with larger sensitivity to their learned associations (which we refer to as $\lambda$, the greek letter lambda, in the following) will quickly prefer the option that previously gave them the highest reward (or the lowest danger), while individuals with low sensitivity will continue to explore alternative options. Sensitivities are expected to show the opposite pattern to the association-updating rate, with larger sensitivities when cues are unreliable but environments are static such that individuals start to exploit the rare information they are learning and lower sensitivities when cues are reliable and changes are frequent such that individuals explore alternative options when conditions change (Daw et al. 2006, Breen & Deffner 2023).
…
The learning of information is reflected by the Rescorla-Wagner rule (Rescorla & Wagner 1972), which includes the association-updating rate (the label of the rate differs across authors) to place weights the most recent information proportionally to the previously accumulated information for that cue (as a proportion the rate can range between 0 and 1, see below for equation). The decision between different options is reflected by relative probabilities (Agrawal & Doyal 2012, Daw et al. 2006, Danwitz et al. 2022), where the sensitivity to learned associations (again, the label can differ) modifies the relative difference in learned rewards to generate the probabilities to choose each option (a value of zero means individuals do not pay attention to their learned associations but choose randomly whereas increasingly larger values mean that individuals show strong biases in choice as soon as there are small differences in their learned associations, see equation below).”
COMMENT 2.4: L80, perhaps the authors could also refer to Dunlap and Stephens, in their 2009 paper “Components of change in the evolution of learning and unlearned preference”, who studied how the predictability of the environment can select learning. In this respect, the wording ‘more stable’ is vague: does it mean that the environment is predictable in the long run? If so, there may be two ‘types of instability’ to differentiate between: a succession of periods of short-term predictability, each involving different knowledge rules, or no predictability at all. Perhaps the authors could discuss how this would (or would not) count in their reasoning. In particular, I myself would expect λ to
matter (and thus be subject to selection) only in totally unpredictable environments, so not if there is only a succession of predictable phases (as was done in the experiment presented, and thus consistent with the results found).
Reply 2.4: Thank you for this reference. This article, and some of your other comments, helped us to rethink the frame of the article. We now differentiate two components of change that individuals might be paying attention to in reversal learning experiments, whether associations between a reward and a cue are probabilistic (e.g. correct option provides reward 80% of time) or fixed, and how frequently the reward changes to be associated with the alternative cue (see reply 2.3).
COMMENT 2.5: When the authors refer to “serial inversions” (L96), they may specify how many inversions were performed.
Reply 2.5 We added more information about the serial reversal learning experiment in the grackles:
“The serial reversal manipulation consisted of switching the rewarded color whenever individuals chose the rewarded option more than expected by chance (criterion of choosing correctly 17 out of the last 20 trials), until their reversal speeds were consistently fast (reaching the criterion at or in less than 50 trials in two consecutive reversals; grackles required between 6-8 reversals).”
COMMENT 2.6: As far as the abstract is concerned, many terms are introduced but not defined at this stage (yet later in the article), which prevents a correct understanding at the beginning. The authors may therefore consider defining terms like “locus” (L100) beforehand.
Reply 2.6: We have reformulated the abstract (see reply 2.2).
COMMENT 2.7: The authors might consider rewording L94 “serial reversal learning - reversing indi- viduals”, as it is difficult for me to understand. Do the authors mean that they have performed further reversals on individuals who have shown reversal ability?
Reply 2.7: We have changed this explanation of the serial reversal experiment (see reply 2.5).
I.4 Research questions
COMMENT 2.8: Although the model test itself is necessary, I would not consider it in the main text, but rather place it in the supplementary material, as a proof of concept. This would reduce the already dense article. And as such, the authors might consider deleting prediction 1, as it seems very strange to ‘predict’ that the statistical approach adopted is reliable, as otherwise this approach would not have been considered for conducting the analysis.
Reply 2.8: As we explain in the revised research questions, one main aim with this research was to determine whether the statistical approach could be adapted to reveal dynamic changes, rather than just static descriptions of states. We therefore feel that the simulations are necessary to reveal both the feasibility and limitations of expanding what has previously been done. We now explain this more clearly in the research questions (see reply 1.2A).
COMMENT 2.9: In prediction 4, the flexible individuals are those with high φ, but perhaps also those with low λ, aren’t they?
Reply 2.9: Yes, with the reframing around the different types of environmental change and how individuals experience these in a single reversal and the serial reversal learning experiment, we have changed the prediction to clarify that both φ and λ can influence the behavioral flexibility of individuals.
“2) Is a strategy of high association-updating ($\phi$) and low sensitivity to learned associations ($\lambda$) best to reduce errors in the serial learning experiment?
Previous modeling work predicts that in situations in which changes are abrupt, but information is reliable, individuals learning in accordance with a Bayesian reinforcement model should show a high association-updating rate and a low sensitivity to learned associations (Dunlap & Stevens 2009, Breen & Deffner 2023). The modeled situations were however abstract and the inferred optimal association updating rates and sensitivities higher than what is usually observed in reversal learning experiments. We therefore perform simulations of the specific behavior exhibited in serial reversal learning experiments to assess how changes in the choices individuals make link to their $\phi$ and $\lambda$ values. In addition, previous studies were only focused on the optimal values for the two parameters in different situations rather than looking at how $\phi$ and $\lambda$ interact to explain variation among individuals. We therefore also use the simulations to determine whether one of the two parameters $\phi$ and $\lambda$ might explain more of the variation in the number of trials individuals need to reach the criterion of choosing the correct option 17 out of 20 times during a reversal..
Prediction 2: We predicted that both $\phi$ and $\lambda$ influence the performance of individuals in a reversal learning task, with higher $\phi$ values (faster learning with a higher association-updating rate) and lower $\lambda$ values (more exploration with less sensitivity to learned associations) leading to individuals more quickly reaching the passing criterion after a reversal in the color of the rewarded option.
3) Which of the two parameters $\phi$ or $\lambda$ explains more of the variation in the reversal learning experiment performance of the tested grackles?Across both the manipulated and control grackles, we assessed whether variation in the number of trials an individual needs to reach the criterion in a given reversal is better explained by their inferred association updating rate or by their sensitivity to learned associations.
Prediction 3: We predicted that both $\phi$ and $\lambda$ explain variation in the reversal performance of the grackles.
4) Which of the two parameters $\phi$ or $\lambda$ changes more for the grackles that improved their performance through the serial reversal experiment?
If individuals learn the contingencies of the serial reversal experiment, they should be reducing their sensitivity to learned associations $\lambda$ to explore the alternative option when rewards change, and increase their association-updating rate $\phi$ to quickly exploit the new reliably rewarded option.
Prediction 4: We predicted that individuals have higher $\phi$ and lower $\lambda$ values during their last reversal of the serial reversal experiment than during their first reversal.”
I.5 Methods
COMMENT 2.10: Overall, in the method, I am not sure that the sample sizes have been clearly stated. So the authors might consider clearly stating them here, as well as in the results, when the sample sizes change.
Reply 2.10: We now state the sample size in the methods, as well as for each statistical analysis we report in the results:
“After their single reversal, the 11 control grackles participated in a number of trials with two identically coloured tubes (yellow) which both had a reward to match their general experiment participation to that of the manipulated group. The other subset of 8 individuals in the manipulated group went through a series of reversals until they reached the criterion of having formed an association (17 out of 20 choices correct) in less than 50 trials in two consecutive reversals.”
COMMENT 2.11: L148, is there a practical reason for not setting initial attractions to 0?
Reply 2.11: There are both theoretical as well as practical reasons not to set the initial attractions to 0. The theoretical reason is that individuals first underwent habituation to and training on a yellow colored tube (to get them to understand that they have to look for hidden food inside the tube), so we would expect them to generally be interested in tubes even if they are then differently coloured for the test. The practical reason is that with the setup here, where there are only rewards, the associations cannot drop to zero because changes in associations are proportional to the previous state. We now explain the rationale for setting the initial attractions in the methods:
“We set the initial associations with both options for all individuals at the beginning of the experiment to 0.1 to indicate that they do not have an initial preference for either option but are likely to be somewhat curious about exploring the tubes because they underwent initial habituation with a differently colored tube (see below), and for estimations at the end of the serial reversal learning experiment set the association with the option that was rewarded before the switch to 0.7 and to the option that was not rewarded to 0.1. Note that when applying equation 1 in the context of the reversal learning experiment as most commonly used, where there are only rewards (positive association) or no rewards (zero association) but no punishment (negative association), associations can never reach zero because they change proportionally.”
COMMENT 2.12: I am puzzled by the choice of “89%” for the compatibility intervals. I agree that the use of these thresholds is arbitrary, but may I ask why not use a rounded value? In other words, it gives the impression that the authors have “tricked” the analysis to fit their expectations, which is certainly not the case. Thus, the authors can further elaborate their reasoning for this choice. Given the low sample sizes, 80% could even be used.
Reply 2.12: By using the 89% confidence intervals we follow the social convention set by Richard McElreath in his book “Statistical Rethinking”. The rationale there is that this value as a prime number indicates the arbitrary nature of any threshold. We had set this value before any of the analyses, so this does not reflect a post-hoc choice. We now refer to this in the methods:
“Following the social convention set in (McElreath 2020), we report the mean estimate and the 89% confidence interval from the posterior estimate from these models.”
COMMENT 2.13: Unless I am mistaken, the ‘batch’, L227, has not yet been defined.
Reply 2.13: The grouping of individuals into batches in the analyses was a remnant from the preregistration. During the experiment, individuals were actually assigned to the experiments in such a way that we did not need to control for which batch which grackle was in. We have removed this from the analyses.
COMMENT 2.14: Also, L171, what does the term “criterion” really refer to? Is it the criterion defined later in 2) L194?
Reply 2.14: We now define what we refer to as criterion at its first occurrence in the introduction:
“The serial reversal manipulation consisted of switching the rewarded color whenever individuals chose the rewarded option more than expected by chance (criterion of choosing correctly 17 out of the last 20 trials).”
COMMENT 2.15: I am puzzled by the choice of criterion (17 out of 20 seems to me an arbitrary but unjustified choice), as it seems to be at odds with the existence of highly exploratory individuals relying little on prior knowledge (low λ, high φ), for whom such a criterion can only be met by chance (and thus, it is unclear to me how a bird with low λ could reverse at all and that this is “cognitively” meaningful). Could the authors expand on this criterion, and the possible consequences on their analysis that it triggers?
Reply 2.15: The criterion was chosen in the original preregistration. It was based on finding a performance that is different from chance, with 17 out of 20 representing a significant deviation from chance with the chi-square test. We now explain this in the methods (see Reply 2.16). We have since used the reinforcement learning model to derive a passing criterion that is based on these underlying processes (10 out of 12), see figures 7 and 8 here: http://corinalogan.com/ManyIndividuals/mi1.html. We mention this in the discussion.
COMMENT 2.16: The authors might consider writing a short paragraph in which they detail more carefully the experimental setting, and the different criteria for individuals to be retained or not, to be considered successful or not (both in the task itself, or to be considered “reversed”, etc.).
Reply 2.16: With the revised framing, where we no longer treat this article simply as an add-on to the main article describing the experiments, we now added the explanation from the original article describing the experiments:
“Great-tailed grackles were caught in the wild in Tempe, Arizona, USA for individual identification (colored leg bands in unique combinations), and brought temporarily into aviaries for testing, before being released back to the wild. After habituation to gain food from a yellow-colored tube, individuals first participated in the reversal learning tasks. A subset of individuals was part of the control group, where they learned the association of the reward with one color before experiencing one reversal to learn that the other color is rewarded (initial reward option was randomly assigned to either the dark-gray or the light-gray tube). Individuals were switched when they had reached the criterion of choosing the rewarded option during 17 of the most recent 20 trials. This criterion was set based on earlier serial reversal learning studies, and is based on the chi-square test which indicates that 17 out of 20 represents a significant association. With this criterion, individuals can be assumed to have learned the association between the cue and the reward [@logan2022manyindividuals]. After their single reversal, the 11 control grackles participated in a number of trials with two identically coloured tubes (yellow) which both had a reward to match their general experiment participation to that of the manipulated group. The other subset of 8 individuals in the manipulated group went through a series of reversals until they reached the criterion of having formed an association (17 out of 20 choices correct) in less than 50 trials in two consecutive reversals. The individuals in the manipulated group needed between 6-8 reversals to consistently reach this threshold, with the number of reversals not being linked to their performance at the beginning or at the end of the experiment.”
COMMENT 2.17: L215, could the authors explain why they used two different settings (wooden box and plastic box)? Personally, I don’t understand at the moment.
Reply 2.17: With the revised framing, where we no longer treat this article simply as an add-on to the main article describing the experiments, we now added the explanation from the original article describing the experiments:
“After the individuals had completed the reversal learning tasks, they were provided access to two multi-access boxes, one made of wood and one made of plastic. The two boxes were designed with slight differences to explore how general the performance of the grackles was. The wooden box was made from a natural log, so was more representative of something the grackles might also encounter in the wild. In addition, while both boxes had 4 possible ways (loci) to access food, the four compartments on the wooden box were all separately filled while the four access ways on the plastic box all led to the same reward. In terms of testing, on both boxes individuals could initially explore all loci. After a preference for a locus was formed (gaining food from this locus three times in a row), this preferred choice became non-functional by closing access to the locus, and then the latency of the grackle to switch to a new locus was measured. If they again formed a preference, the second locus was also made non-functional, and so on. The outcome measures for each individual with each box were the average latency it took to switch to a new locus and the total number of loci they accessed. For details see Logan et al. 2023.”
COMMENT 2.18: L246-248, the authors indicate that they take the distance to the median to characterize a U-shaped pattern. I have many questions about this: is it missing in the text that they actually take the absolute difference from the median (thus they use distance in its true mathematical definition)? The tables suggest that the authors did as well as the script. However, assuming they did, this does not evaluate a U-shaped pattern, but only a “triangle-shaped pattern”. Secondly, why does it have to be centred on the median of the group. Can the authors justify this? I would expect centering on the mean (as would do the polynomial regression). From the script, the authors used the function standardize, but I could not find from which package it is (is it the standardize package?), there what it did and whether the “median” was a typo or not. As a second exploration, they used the square of φ or λ. This approach assumes that the U-shaped model is 0-centred, unless a linear term is added (in which case the fitted estimates may imply that the polynomial is not 0-centred; from the script I don’t see any linear terms). If this is the case, then I don’t understand why model first a linear relationship and then a polynomial relationship, and discuss both in the results. Can the authors explain why they did this? From my point of view, I would encourage the authors to adopt a stepwise approach (which is generally not to be done in linear modelling when considering different variables, as specified by Mundry and Dunbar, 2009 “Stepwise model fitting and statistical inference: turning noise into signal pollution”, but not the case here). First, I would consider the polynomial term (with the linear term), and if it is not significant, I would simply transform the model into a linear model (since the second order term is, in fact, unnecessary).
Reply 2.18: In response to this comment, which was also made by the other reviewer, we changed these models to include the quadratic terms for phi and lambda to explore the potential non-linear relationships. See reply 1.5.
COMMENT 2.19: Finally, why were the two “box contexts” treated differently, instead of in a unique model, adding the box as a control variable?
Reply 2.19: The assumption prior to the experiment was that the grackles might interact differently with the two boxes because the wooden box might represent a more “natural” object, which might for example change their latency to approach the box. With this expectation, the decision was made beforehand to treat and analyze the two boxes separately. See reply 2.17.
5
I.6 Results
COMMENT 2.20: L253, the authors might consider a quick reminder of what φ and λ refer to.
Reply 2.20: We now restate what the two parameters are in the first sub-header of the results:
“Power of Bayesian reinforcement learning model to detect short-term changes in the association-updating rate $\phi$ and the sensitivity to learned associations $\lambda$”
COMMENT 2.21: As the authors point out, the values estimated from the reversal phase alone are not those simulated. However, we do see a linear relationship. So why can’t these values be used in a practical way for further research? Also, do the authors have an explanation as to why the combination of initial and reversal (and not just the initial, which was not tested), is more conducive to deducing the parameters? I am sorry that this is not clear to me from the current explanations.
Reply 2.21: We have expanded the results section to provide further explanations for why the values were calculated from the choices of just a single phase (we checked both lambda and phi for just the choices in the initial association phase and just the choices in the first reversal). The issue is that the underestimation of one parameter leads to a contingent shift in the estimation of the other parameter (e.g. if the model underestimates the phi of an individual, it will automatically assign it a larger lambda value and vice versa). In addition, while a given series of choices occurs during a single phase, they could potentially be explained by different combinations of phi and lambda, these different combinations make divergent predictions about how an individual should behave right after a reversal. Including two phases (initial association plus first reversal, two subsequent reversals across one switch) appears to be sufficient to recover the correct phi and lambda values.
“Applying the Bayesian reinforcement learning model to simulated data from only a single phase (initial association, first reversal) revealed that, while the model recovered the differences among individuals, the estimated $\phi$ and $\lambda$ values did not match those the individuals had been assigned (Figure 1). We realized that $\phi$ and $\lambda$ values were consistently shifted,with the Bayesian estimation adjusting both parameters towards the mean away from extreme values. Simulated individuals who were assigned large $\lambda$ values were estimated to have a smaller $\lambda$ values but in turn estimated to have $\phi$ values such that they would reach criterion in a similar number of trials because while the model assumed that they were more exploratory the model also assumed that they updated their associations more quickly. Similarly, individuals with large $\phi$ values were estimated to have smaller values but in turn were estimated to have larger $\lambda$ values than those they were assigned. Because the estimation from a single reversal did not accurately recover large values for either parameter, both the estimated $\phi$ values (slope of the correlation between the estimated and the assigned $\phis$ +0.15, confidence interval +0.06 to +0.23, n=626) and the estimated $\lambda$ values (slope of the correlation between the estimated and the assigned $\lambdas$ +0.58, confidence interval +0.48 to +0.68, n=626) were underestimates of the assigned values. In addition, this shift means that, even though simulated individuals were assigned $\phi$ and $\lambda$ values randomly from across all possible combinations, the estimated values showed a strong positive correlation as the model had to make up the shifts in estimates of one parameter through shifting the estimate of the other parameter (slope of the correlation between the estimated $\lambda$ and estimated $\phi$ values +505, confidence interval +435 to +570, n=626).”
COMMENT 2.22: The claimed linear relationship (Figure 2) does not seem linear to me (although the median, and not the mean on which statistics are conducted, is plotted). Yet, linear modelling could lead to significance as it seems that the relationship is always monotonically decreasing. Is this “non-linearity” due to the fact that the data have been grouped into categories (x axis)? If not, the authors may consider non-linear regression (i.e. generalized linear models).
Reply 2.22: The data were only grouped for the figure for illustration purposes - all analyses were based on the actual values. For the analyses, we did though now change the statistical model to include a non-linear link (see reply 1.2B). We also changed Figure 2 to present the raw values and we mention in the figure legend that the grouping was only added for illustration purposes.
COMMENT 2.23: In L287, the authors refer to the “last two reversals”: it is not clear whether the initial and the last two are used, or only the last two. In this case, I do not understand because the authors have shown that using only one reversal can lead to biased estimates. Although the “penultimate” reversal serves as a “new initial”, is it not already biased as well? Would it change the results if we also considered the true initial, and the last two reversals for the other manipulated individuals?
Reply 2.23: The issue with the estimation of phi and lambda from a single reversal does not appear to be because a given reversal is somehow “biased”, but because a single phase (either just the initial association learning phase or a single reversal phase) does not provide sufficient information for the model to resolve the two parameters. Estimating across one switch (which means two series of choices) appears to provide sufficient information because the different combinations of phi and lambda that could potentially explain the observed choices during a single series of choices make different predictions for how an individual would perform right after the reward has switched to the alternative option. We have added this further explanation in the results:
“While different combinations of $\phi$ and $\lambda$ could potentially explain the series of choices during a single phase (initial discrimination, single reversal), these different combinations lead to different assumptions about how an individual would behave right after a reversal when the reward is switched to the alternative option, making it possible to infer the assigned value when combining behavioral choices from two phases (initial learning plus first reversal, or two subsequent reversals).”
COMMENT 2.24: In L290, the authors say that the changes in λ are small compared to the changes in φ. As these two items are on different scales (one is linear, the other is embedded in an exponential), I’m not sure this is as straightforward as expected.
Reply 2.24: We now added descriptions of relative changes, and what they mean for the behavior, for both φ and λ (see reply 2.27).
COMMENT 2.24: The authors may consider removing from the results (and inserting into the discussion) the paragraphs between : L296-298, L303-305, L361-367, L373-378. In particular, I would add in the discussion (or in the introduction) the parallel with previous work, but keep it separate from the description of the results.
Reply 2.25: With the reframing of the article we have also completely rewritten the discussion. We now discuss the relevance of our results in relation to the six research questions we set out in the introduction. We have also removed several of the interpretations from the results section, though we decided to leave some of these in if they are about comparisons with other results.
COMMENT 2.26: L303-305, although I tend to agree with the authors’ statement (summarised in a way by the idea that φ is a driver of response, and λ a constraint), I feel that, presented as it is, the analysis is biased by the lack of interaction between φ and λ in the models. Yet, looking at the tables and scripts, these interactions have been tested, haven’t they? Many models, not mentioned in the main text (or by mistake) are available in the various summary tables. Is this a mistake?
Reply 2.26: The reinforcement learning model, as a mechanistic model based on equations 1 and 2, does not assume an interaction between φ and λ. We therefore decided not to model such an interaction or test for it. The previous set of models in the tables were exploratory, and, as mentioned above, we now removed these because it was unclear how to interpret them. We do assume that the two parameters can have a joint, balancing influence on observed behavior, which we modeled by having both parameters as predictors in the same models such that their relative influences in the presence of the other would be estimated.
COMMENT 2.27: L306-308, this statement seems strong to me, as the two variables are not scaled. Could the authors consider further quantifying the changes (e.g., relative changes) to support their assessment?
Reply 2.27: We now split these different inferences (influence of phi and lambda on performance of grackles and change in phi and lambda through the serial reversal learning experiment) into different research questions and sections in the results. For the change, we now express this on a relative scale as well:
“For the manipulated grackles, the estimated $\phi$ values more than doubled from 0.03 in their initial discrimination and first reversal (which is identical to the average observed among the control grackles who did not experience the manipulation) to 0.07 in their last two reversals (estimate of expected average change: +0.03, confidence interval +0.02 to +0.05, n=8). The $\lambda$ values of the manipulated grackles went slightly down from 4.2 (again, identical to control grackles) to 3.2 ( estimate of average change: -1.07, confidence interval -1.63 to -0.56, n=8) (Figure 3).”
We also translate the changes in the values on what they mean for the behavior:
“A grackle with a 0.01 higher $\phi$ than another needed about 10 less trials to reach the criterion.”
“This decrease in $\lambda$ meant that grackles quickly found the rewarded option after a switch in which option was rewarded: while in their first reversal grackles chose the newly rewarded option in 25% of the first 20 trials, in their final reversal the manipulated grackles chose correctly in 35% of the first 20 trials.”
COMMENT 2.28: L314-316, the lack of correlation is consistent for φ, I think, because the changes in φ depended on the value of φ at the start. However, this explanation is not valid for λ. Unless I have forgotten, this is not explained further in the discussion. Do the authors have a possible explanation?
Reply 2.28: With the reformulation of the models, the results now indicate that also for λ, individuals who already had lower values changed less than individuals who had higher values at the beginning. We have added a new section about the individual-level differences in the changes. We find that with our data we cannot predict how much individuals change their φ or their λ, but that there seem to be two different strategies at the end. We also added a new figure to illustrate this point: here is the legend for Figure 6:
“We observed that, among the grackles who completed the serial reversal learning experiment, there was a negative correlation between their $\phi$ and $\lambda$, indicating that individuals used slightly different strategies to reach the criterion (choosing the rewarded option in 85% or more of trials) quickly after the reward switched (when they had chosen the now rewarded option in 15% or less of trials). Individuals with a higher $\phi$ and lower $\lambda$ (light blue line) quickly learn the new associations but continue to explore the unrewarded option even after they have learned the association, leading to a curve with a more gradual increase throughout the trials. Individuals with a lower $\phi$ and higher $\lambda$ (dark blue line) take longer to switch their associations but once they do only rarely choose the non-rewarded option, leading to a more S-shaped curve where the initial increase in probability is lower and a more rapid rise later.”
COMMENT 2.29: L329-331, is it based on a visual assessment or on additional statistics not shown here? If the former, the authors might consider softening things by adding “tends to” to the various assessments. For example, I can only see that for both parameters, one individual is not following the group trend.
Reply 2.29: We added a new section about the changes through the serial reversal learning experiment, including statistical comparisons for how individuals change and whether they are different from the beginning:
“Great-tailed grackles who experienced the serial reversal learning manipulation reduced the number of trials they needed to reach the criterion from an average of 75 to an average of 40 (estimate of change in number of trials -30.02, confidence interval -36.05 to -24.16, n=8). For the manipulated grackles, the estimated $\phi$ values more than doubled from 0.03 in their initial discrimination and first reversal (which is identical to the average observed among the control grackles who did not experience the manipulation) to 0.07 in their last two reversals (estimate of expected average change: +0.03, confidence interval +0.02 to +0.05, n=8). The $\lambda$ values of the manipulated grackles went slightly down from 4.2 (again, identical to control grackles) to 3.2 ( estimate of average change: -1.07, confidence interval -1.63 to -0.56, n=8) (Figure 3). The values we observed after the manipulation in the last reversal for the number of trials to reverse, as well as the $\phi$ and $\lambda$ values estimated from the last reversal, all fall within the range of variation we observed among the control grackles in their first and only reversal (Figure 3). This means that the manipulation did not push grackles to new levels, but changed them within the boundaries of their natural abilities.
As predicted, for $\phi$, the increase during the manipulation fits with the observations in the simulations: larger $\phi$ values were associated with fewer trials to reverse. The improvement the grackles showed in the number of trials they needed to reach the criterion from the first to the last reversal matched the changes of their $\phi$ values (confidence interval +1.54 to +14.22, n=8). The improvement did not match the change in their $\lambda$ values (confidence interval -4.66 to 9.46, n=8).”
COMMENT 2.30: L334, the author might consider replacing “With the Bayesian approach, we used one model to estimate. . . ” with “We used a Bayesian structural equation modelling approach...”, as I think what the authors have done fits the structural equation modelling framework.
Reply 2.30: We removed these analyses because they were exploratory and we were therefore limited in our interpretation (see reply 1.7).
COMMENT 2.31: I am puzzled by the results of this modelling. Indeed, from what I understood, it seems that the initial value of φ conditions the whole response of the bird during the whole experiment. However, as I understand it, the changes in φ (if I am right, these changes are evaluated by comparing the initial/first reversal and the last two reversals in the birds going through multiple reversals, which is not clearly indicated) also depend on this value, which finally implies that there is no correlation between the first and the last value of φ. Why then is the first value the trigger for the whole response, including subsequent performance which should, likely, be related to the φ at the time action is performed?
Reply 2.31: As mentioned, we replaced these analyses because it was difficult to interpret the relationships. We have now focused on a clearer set of research questions and their predictions.
COMMENT 2.32: Maybe I missed it, but for point 3), is there, at least visually, a difference between the birds tested for one or more inversions? The authors could add this information in Figure 5 (e.g. by differentiating the types of points).
Reply 2.32: For the analyses of how phi and lambda link to the performance on the multi-access box, we decided not to split the manipulated from the control birds because of the small sample size. Our approach here also follows what we did in the previous paper where we compared the performance on the multi-access boxes with the number of trials birds needed to reach criterion in the first reversal. The decision to combine all birds was made in the preregistration, before the data collection started. The reasoning is that birds in the control group received as much experience with experiments than manipulated birds, because they were given a large number of trials with two yellow tubes that were both rewarded after they completed their reversal learning experiment. We have now added this information about the experimental procedure in the method section (see replies 2.10 and 2.16).
I.7 Discussion
COMMENT 2.33: In my opinion, the discussion does not comment sufficiently on the results. Although the first paragraph does a good job of summarising the main results, they are still insufficiently commented on and compared to the literature (without giving a picture of the literature without explicit comparison to the study, as I felt in L430-450 or simply repeating the results, as I felt in L453-463 which could be elegantly linked to the idea of behavioural types). In addition, I find that there is a too strong emphasis on the importance of mechanistic modelling, which, while useful and interesting, remains a widespread approach (e.g. in the field of movement ecology). To help solve this issue, it would be beneficial to remove some paragraphs from the results (as indicated above) and add them to the discussion. In addition, the authors may comment on several of these points (and others that I might have forgotten):
Reply 2.34: As mentioned in Reply 2.25: With the reframing of the article we have also completely rewritten the discussion. We now discuss the relevance of our results in relation to the six research questions we set out in the introduction. We have also removed several of the interpretations from the results section, though decided to leave some of these in if they are about comparisons with other results.
COMMENT 2.34: Why is there a difference in performance (and how is this affected by the two parameters of interest) between the boxes? Does this have any relevance? Furthermore, I still wonder why two boxes and why they were treated separately.
Reply 2.35: With the reformulated models that include both the linear and non-linear relationships through the quadratic function, we now find that the results of the relationship between phi, lambda, and the performance on the two boxes are relatively similar. We added the explanation for why the two boxes were treated separately to the methods (see Reply 2.17). We also made the statements more cautious, given the small sample sizes, which might also explain why for the latency to attempt a new locus we did not find exactly the same associations for the two boxes:
“ We are limited though in our interpretation by the small sample sizes, and more detailed studies would be needed in order to fully understand how the association-updating rate and the sensitivity to learned associations might shape the performance on the multi-access boxes.”
COMMENT 2.36: How does the environment of the grackles differ from the experiments (which might explain why the changes in φ and λ differ between individuals in the experiments, both in their absolute values and in the magnitude of their change).
Reply 2.36: In separate analyses performed since we submitted the previous version of this article (Logan et al. 2019 http://corinalogan.com/Preregistrations/g_flexforaging.html, but we are still working on the post-study write up), we now found that birds who experienced the serial reversal learning experiment continued to show different behavioral flexibility in their foraging behavior in the wild for at least several months after being released back into their natural environment compared to birds in the control group. We now mentioned this in the discussion:
“How frequently and how quickly individuals change their behavioral flexibility in their natural environments is unclear. Individual differences might persist if their different behavioral flexibility might lead them to continue to experience their environment differently. For the great-tailed grackles, we have some indication that after releasing them into their original environments, differences in behavioral flexibility between the manipulated and control individuals persisted for several months, with individuals who had changed their $\phi$ and $\lambda$ appearing to switch more frequently between food types and foraging techniques”
COMMENT 2.37: Why don’t the simulations and observations match perfectly, as far as λ is concerned? For my part, I suspect that (1) there is a joint effect of φ and λ. Although the authors mention the idea of a trade-off (which might echo the idea of a behavioural syndrome that might be worth discussing), the analysis, description of results and discussion suffer in my opinion from the fact that these two parameters are constantly separated.
Reply 2.37: With the revised framework, we now make a distinction between a single reversal, where individuals do not experience a regularly changing environment but where cues appear reliable, and the serial reversal, where birds do experience that associations between cues and rewards frequently change. The simulations only had a single reversal, and phi was more important. Also thanks to the article by Dunlap & Stevens you pointed us to, we now make and test the prediction that lambda is of more importance for the serial reversal aspect, facilitating individuals to react quickly after a reversal in which only one of the options is being rewarded. This hopefully makes it clearer why it is helpful to separate the two parameters.
COMMENT 2.38: (2) A second interesting point of discussion might be to see how the magnitude of the changes in the simulation corresponds to the magnitude of the changes in the observations. Perhaps the decrease in λ observed for the observations is largely offset by an increase in φ which is larger than in the simulations.
Reply 2.38: Thanks for this suggestion. We indeed find that that individuals who show larger changes in lambda can offset this with a concurrent change in phi such that they reach the criterion in a similar number of trials, albeit with different strategies:
“This decrease in $\lambda$ meant that grackles quickly found the rewarded option after a switch in which option was rewarded: while in their first reversal grackles chose the newly rewarded option in 25% of the first 20 trials, in their final reversal the manipulated grackles chose correctly in 35% of the first 20 trials. Despite their low $\lambda$ values, manipulated grackles still chose the rewarded option consistently because the increase in $\phi$ compensated for this reduced sensitivity…Individuals appeared to use different adjustments to their strategies to improve their performance through the manipulation. There was a negative correlation between the individuals’ $\phi$ and $\lambda$ after their last reversal (-0.39, 89% confidence interval: -0.72 to -0.06, n=8), indicating that they ended up with different strategies from along the range of potential solutions. While some individuals quickly learn the new reward structure after a switch but continue to explore the alternative option even after they have learned the new associations (high association-updating rate and low sensitivity to learned associations), other individuals take longer to learn that the reward has switched but once they have reversed their associations they rarely choose the unrewarded option (Figure 6). Together, this suggests that all individuals improved by the same extent through the manipulation such that the differences in their performances persisted, but they ended up with different strategies of how to quickly reach the criterion after a reversal by either having a high association updating rate or a low sensitivity to their learned associations.”
COMMENT 2.39: The authors might consider discussing the multiple pairwise comparisons further, as it seems to me that they are not entirely consistent (perhaps due to the sample size). For example, the initial φ is correlated with many variables (of performance or of the change in φ itself) but not with the last one (which is nevertheless U-shaped related to some performance). On the contrary, λ has no such relationship, although it is negatively correlated with φ. To me, this is confusing. As I suspect the sample size (as well as the experimental setting, which seems to select for a very specific type of long-term instability) to be one of the reasons for this, this could be discussed and reported with caution. Parallels with results in other species could help identify results that are likely to be erroneous (either missed or significant by chance).
Reply 2.39: As mentioned above, we have removed these multiple pairwise correlations because they were difficult to interpret.
COMMENT 2.40: It is not entirely clear to me that φ should have a U-shaped relationship with the latency to resolve a new locus. In particular, when φ is very large, if λ is large enough, a bird should immediately move to another solution. Thus, this U-shape may not be interpreted as claimed by L469-470, but may be the simple consequence of the negative relationship between the two parameters (which may prevent λ from being large enough). It seems to me therefore important to discuss this negative relationship (i.e. the trade-off) further.
Reply 2.40: Yes, the negative relationship does indeed suggest a potential trade-off. The observation that grackles ended up with different strategies at the end of the serial reversal learning experiment to achieve the same performance now offers a potential explanation for why there could be the U-shaped relationship: individuals perform well either if they have a high association updating rate but a low sensitivity or if they have a high sensitivity but low association updating rate.
COMMENT 2.41: Why is φ (and in particular the initial φ, as questioned in my point on the results) the main driver of the response? Are there related results in the published literature? Authors may wish to consider the theoretical literature on the exploitation-exploration trade-off, which is somewhat similar to what is stated here, where φ tends to correspond to the “memory” component, hence exploitation, and λ to the “exploration” component (e.g. Berger-Tal et al., “The Exploration-Exploitation Dilemma: A Multidisciplinary Framework”, as a starting point for reading).
Reply 2.41: Thank you for the pointer to this literature on the exploration-exploitation tradeoff. We decided to keep a more psychological focus for the new frame, and now added references to the (very few) papers we found where the authors also applied the reinforcement learning model to reversal learning experiments and found that φ in particular appears to be relevant to explain variation among individuals. However, we added the link to the exploration-exploitation literature in the discussion:
“First, it highlights the key pieces of information that individuals likely pay attention to to adjust their behavior. This provides ways to also link their performances and inferred cognitive abilities to how they experience and react to their natural environments. In particular, literature on foraging behavior that focuses on the likely trade-offs between the exploration versus exploitation of different options has a similar focus on gaining information (exploration) versus decision making (exploitation) (Berger-Tal et al. 2015, Addicot et al. 2017).”
COMMENT 2.42: In addition, in order to improve the flow of the discussion, the author could consider adding sub-headings, indicating the outcome that is being discussed, and these sub-headings could in fact echo the research questions/outcomes. It seems that the order of the discussion already reflects this idea. Making it more explicit could help to identify the key points to be discussed, for the reader, but also for the authors themselves.
Reply 2.42: We decided not to introduce subheaders in the discussion, but it is now structured to follow the new frame with the different research questions.
COMMENT 2.43: Finally, to broaden the scope of the article and make these results more relevant from an eco-evolutionary point of view, the authors could consider assisting the reader with an additional figure linking flexibility, behavioural patterns and environmental characteristics, which could be fully elaborated in a “speculation” paragraph (as happens in some journals, such as “Oikos”). This could be useful both for the introduction/prediction and for their discussion. For example, I am thinking of a figure similar to the one published by Riotte- Lambert and Matthiopoulos (“Environmental Predictability as a Cause and Consequence of Animal Movement”) on the effect of environmental contingency and constancy (the underlying components of predictability) on the spatiotemporal memory of animals. Here, instead of using contingency and constancy, φ and λ could be used to create two matrices describing respectively (1) which type/level of behaviour/flexibility and (2) environment correspond to which values of the two parameters (e.g. environment “predictable in the short term”, “predictable in the long term”, etc.), highlighting the area of this two-dimensional landscape in which the grackles under study are located. This could allow the authors to broaden the link between behavioural flexibility and the performance, and ultimately the evolutionary success, of the species, as well as pointing out the limit of the applicability of their findings. This is only a suggestion, however, and the authors can think of something else that would place their work more strongly in an eco-evolutionary framework.
Reply 2.43: We decided to focus the framework more on the psychological angle, looking at what applying new approaches to behavioral experiments can potentially reveal about underlying cognitive processes. The ideas suggested here, and in the referenced article, will be very useful though for our additional analyses that look at foraging and movement behavior of the grackles in their natural environments.
I.8 Miscellaneous
COMMENT 2.44: Although I believe from previous articles and team submissions that this project has met animal ethics guidelines and has been approved by official entities, the authors might consider writing such a paragraph (unless I missed it, my apologies).
Reply 2.44: We have added the information about ethical approvals to the methods section:
“The research on the great-tailed grackles followed established ethical guidelines for the involvement and treatment of animals in experiments and received institutional approval prior to conducting the study (US Fish and Wildlife Service scientific collecting permit number MB76700A-0,1,2; US Geological Survey Bird Banding Laboratory federal bird banding permit number 23872; Arizona Game and Fish Department scientific collecting license number SP594338 [2017], SP606267 [2018], and SP639866 [2019]; California Department of Fish and Wildlife scientific collecting permit number S‐192100001‐19210‐001; Institutional Animal Care and Use Committee at Arizona State University protocol number 17-1594R; Institutional Animal Care and Use Committee at the University of California Santa Barbara protocol number 958; University of Cambridge ethical review process non-regulated use of animals in scientific procedures: zoo4/17 [2017]).”
Comments on the form
II.1 Main text
COMMENT 2.45: Authors should stick to the Greek letter (φ, λ) in text, figures and tables (unless there is a reason I didn’t understand for the differences, but it sometimes happened in the same line, e.g. L426). For the figure, this can be done in R using the “expression” function of the base package immediately available. I would like to point out some typos “/phi” and “/lambda” L253, L309. As this is written in Rmarkdown, I have seen that the “/” is inverted (you should use the opposite one).
Reply 2.45: We have now consistently switched the notation to the Greek letters 𝜙 and 𝜆, except for when we first introduce and define these terms (see reply 1.13).
COMMENT 2.46: Why label the paragraphs that follow the discussion with letters? Perhaps the authors are considering deleting it (as PCI does not edit for publication).
Reply 2.46: The labeling of paragraphs was a formatting decision for the different output formats that we generated (html, rmarkdown). For the PDF, we have now removed these letters indicating the different sections.
II.2 Abstract
COMMENT 2.47: L24, the authors may add “gaining” after “allows”.
Reply 2.47: We have completely rewritten the abstract (see reply 2.2).
II.3 Introduction
COMMENT 2.48: L68-69, the authors might consider simplifying the sentence “based on the reward they perceived during their most recent choice relative to the rewards the perceived when choosing this option previously” to “based on the reward of the most recent choice relative to the previous rewards of that option”.
Reply 2.48: We have reformulated the description of the processes that are expressed in the Bayesian reinforcement learning model:
“The learning of information is reflected by the Rescorla-Wagner rule (Rescorla & Wagner 1972), which includes the association-updating rate (the label of the rate differs across authors) to place weights the most recent information proportionally to the previously accumulated information for that cue (as a proportion the rate can range between 0 and 1, see below for equation).”
We
II.4 Methods
COMMENT 2.49: In the equations, some spaces seem to be missing (e.g. in equation 1 of L141), before
and after the “=” and “+”.
Reply 2.49: We added spaces before and after the mathematical signs in the two equations.
COMMENT 2.50: In L142, the authors may write that i takes the value 1 or 2 as follows: i ∈ {1, 2}.
Reply 2.50: Thank you, we have changed this accordingly.
COMMENT 2.51: In equation 2, authors may consider writing the exponential function in its classical form (e.g., ex), to improve readability.
Reply 2.51: In the mathematical notation for statistical models we have seen, exponential is abbreviated as exp, so we have kept it this way.
COMMENT 2.52: References to the author C. Logan are different (e.g. L135, Logan CJ et al., L 185 C. Logan et al.). The authors might consider making the different citations more consistent, both in the main text and in the reference list. I suspect that this is due to differences in writing in the bib file associated to the Rmarkdown document. In addition, there are two Logan et al. 2022 references, but they are cited the same way in the text.
Reply 2.52: Thank you. We double-checked the bibtex file we used to generate the reference list to make sure the references are consistently formatted and there are no duplicates.
COMMENT 2.53: In the main text, I would consider using italicised variables when they are quoted (e.g. when explaining variables in equations, t, P, j, i, etc.).
Reply 2.53: We italicized the quoted variables.
COMMENT 2.54: In L157, the reference to R (which I personally would have italicised) is in square brackets, instead of parentheses. Again, if the authors use Rmarkdown, this is due to the “;” used to separate the version from the reference. A simple “,” would solve the problem.
Reply 2.54: Thank you, we have changed it so the reference to R appears in the same way as the remaining references.
COMMENT 2.55: L184, I find the reference to the PDF unusual. Authors can only consider adding the book reference, which would be listed with all the other citations.
Reply 2.55: We have changed this mentioning of the preregistration into a reference that is included in the citation list.
COMMENT 2.56: For the equations in subparts 1) and 3), the authors may consider: (i) writing everything in a fully mathematical way (e.g., N (μ, σ), μ = a + bφ + cλ, αbatch etc.). Furthermore, it seems to me to be unnatural (though somewhat understandable) to label the underlying distribution used for the likelihood test as “likelihood”, as it is not the likelihood itself. I would consider specifying only the formula for the linear model (and if not, at least labelling it as “model” or “the model”, but only one of them, see the difference between 1) and 3)), and then specifying where the parameter used as the output variable comes from. For example, for 3) it would be: “We modelled the probability to solve a locus p as a function of φ and λ such as ln p = αbatch +βφ+γλ where p is the probability in 1−p a binomial distribution such that Nloci solved = B(4, p).
Reply 2.56: We have rewritten all the descriptions of the statistical models (see reply 1.2C). Given that we implemented all models with functions of the statistical package ‘rethinking’, we decided on the mathematical notation used by the author of the package (McElreath 2020) for consistency.
COMMENT 2.57: In addition, I would call (Equation 3, 4, etc.) the equations just mentioned, for consistency with equations 1 and 2.
Reply 2.57: To us, the descriptions of the statistical models are different from the description of the equations that we also used in an analytical form. We therefore decided not to label the statistical models, which is consistent with the presentation in McElreath 2020.
II.5 Results
COMMENT 2.58: In L314, I think there is a space missing before “Table 1”.
Reply 2.58: We have removed the table and all references to it.
COMMENT 2.59: References to models sometimes capitalise the “m” (e.g. L369), and sometimes not (L385). The authors might consider copying this (and other typos, e.g. L367, no space between the comma and the 3).
Reply 2.59: We now report the statistical results directly in the results text and therefore removed the references to the numbered models.
II.6 Discussion
COMMENT 2.60: The authors could consider deleting “go-no go”, L480, which does not provide any information, and only mentioning an “inhibitory task”, or further detail the layout of this task.
Reply 2.60: Good point, also “go - no go” is a term that is not familiar to most readers. We have rephrased the sentence:
“For example, we previously found that grackles who are faster to complete an inhibition task, where they had to learn to not react to a cue in order to gain a reward, were slower to switch loci on the multi-access boxes (Logan et al. 2021).”
II.7 Figures
COMMENT 2.61: In Figure 1, the authors might consider capitalising the first word of each axis, as is done in other figures.
Reply 2.61: We capitalised the first word of all axes labels.
COMMENT 2.62: In Figure 2, the authors might consider adding the mean, as statistics are working on those, and note the median depicted by the boxplot. Furthermore, they may consider removing the legend and colouring the Greek letters φ and λ as in the boxplot, to make the figure simpler. As the figures appear to have been made with ggplot, this can easily be done by using the ggtext package, and labelling the y axis with html, for example (the colours are not those used, however).
ylab("<span style='font-size:20pt;font-weight:bold'>Standardised
<b style='color:#458b74'>&Phi</b>
<b style='color:#ffc125'>&Lambda</b>
of simulated individuals </span>")
Reply 2.62: We replaced the boxplot with dots showing the actual values. We also added text to the figure legend to clarify that while in the figure the values are shown together in groups, the analyses were always performed with the ungrouped actual numbers. Thank you also for the advice on how to change the axis title, we have indicated the respective coloring for φ and λ there.
COMMENT 2.63: In Figure 3, the authors may consider keeping the background white (for consistency with the other figures), as well as labelling the y axis rather than the graph itself. In addition, to be consistent with Figure 2, the title of the legend could be capitalised.
Reply 2.63: We have changed the background of this figure to have the presentation more uniform throughout. We decided however to keep the labels above the plots in this figure because they help guide the reader for the comparison in this figure with multiple panels.
COMMENT 2.64: In Figure 4, the authors can distinguish between significant and non-significant pairwise comparisons (e.g., dashed or plain lines) to make it more readable (perhaps the coefficient of estimates and its compatibility interval could also be added to the middle of the arrow).
Reply 2.64: We have removed the previous Figure 4 (see Reply 1.7).
COMMENT 2.65: Tables
The authors may rename the models, and specify the output variable (while being consistent, the model is sometimes capitalized, e.g. model 6, or not, other models), so that the reader can quickly identify which model it corresponds to, as there are many presented, instead of just naming (“model 7 plastic” etc.). Also, I would like to point out that the model numbers in the text and in the tables seem to me to be different (e.g. L346, I believe the authors are referring to model 6 and not 20). The model numbers in the text do indeed start at 17, if I am not mistaken.
The authors may want to double-check the different names of the variables: intercept is sometimes called intercept per bird or simply intercept (whereas it is referred to as a or α in the equations), the other variables include estimates (b * lambda), * is not a mathematical term (which is ×; yet I believe estimates should not be included in the label).
• The authors could consider highlighting the bold lines where significant. This would make the tables easier to read. An alternative could be also to provide forest plots, instead of such tables.
Reply 2.65: We have removed the tables and now report all statistical outcomes directly in the result section.
Decision by Aurélie Coulon, posted 08 Nov 2022, validated 08 Nov 2022
Dear Dr Lukas and collaborators,
Two reviewers have assessed your preprint called “Behavioral flexibility is manipulatable and it improves flexibility and problem solving in a new context: post-hoc analyses of the components of behavioral flexibility”. One of them, Maxime Dahirel, also reviewed the 2 other post-study manuscripts of the preregistration that received in principle recommendation on 26 mar 2019.
Based on these reviews and my reading of your preprint, I think it has a good potential interest. However, several aspects need to be worked, especially to make your work clearer (more explanations of the theory and of the methods, more streamlining of the analyses and results) and more convincing. For example, some aspects related to the simulation work are unclear, which makes its goals and interpretation uncertain. The two reviewers made very precise and extensive comments, that will be important to take into account to reveal the potential of your work.
Best,
Aurélie Coulon,
Recommender, PCI Ecology.
Reviewed by Maxime Dahirel, 27 Oct 2022
I have now read the manuscript entitled “Behavioral flexibility is manipulatable and it improves flexibility and problem solving in a new context: post-hoc analyses of the components of behavioral flexibility” by Lukas et al. This manuscript is the third emerging from a three-way split of a previous large manuscript that had an in-principle preregistration acceptance. Contrary to the other two and as indicated in its title, it is however entirely relying on non-preregistered data analyses, and as such may not benefit a priori from that in-principle preregistration acceptance.
I have mixed feelings about this manuscript. On the one hand, the authors root their analysis in a wish to bring more principled analysis methods to behavioural data, explicitly grounded in preexisting theoretical research, which hopefully should lead to more interpretable and transferable results. The theoretical model they root their manuscript on is relatively clearly presented, and seems appropriate (from an external but quantitatively-minded viewpoint). However, the authors also consistently underdescribe the protocols, data, and results, which make the manuscript difficult to parse for anyone who hasn’t read the first Logan et al. preprint immediately before (or in some cases, the original preregistration). They also seem to either make some mistakes in the implementation of the analysis, and/or fail to accurately explain what they did in the manuscript. While I did read the attached code, I note that it is not always easy to decide which of these two alternatives it is from it.
Please find below my detailed point-by-point comments:
COMMENT 1:
First paragraph of the Introduction: I am sceptical of the choice to frame the introduction of the paper so heavily around the replicability crisis. On the one hand, yes the study was preregistered, and indeed theory-minded models as the ones used here are a way to increase interpretability of, and confidence in research results. On the other hand, this entire paper is a non-preregistered post-hoc re-analysis (a series of such analyses actually), and of a dataset with a relatively small sample size. These are some of the exact issues that have been (with different levels of justification) involved in the so-called replicability crisis.
I would advise not to rely too much on that framing, or at least not that generally/broadly. The narrower idea that analyses of behavioural data may be more meaningful/interpretable/transferrable if they rely on models explicitly rooted in theory, rather than general-purpose “ready-to-wear” statistical analyses (“heliocentric” vs “geocentric” models, to keep (McElreath, 2020)‘s analogy), is a sound one though.
COMMENT 2:
There is a number of elements in the Methods description that at best require large amounts of clarifications, and at worse to re-do or remove entire analyses:
2A:
The aims and design of the simulation analysis (Methods “1) Using simulations to check models …” ) are very unclear. Is it (a) to determine the contributions of phi and lambda to learning variation in general? (b) the specific grackle dataset? (c) In the statistical population from which these grackles originate?
From reading the comments in the attached code (!) it actually appears to be “none of the above: it seems that the aims of that part of the study is to test whether the theory-minded model is able to recover the parameter values used to generate the simulated data that were used for the power analysis, back during the preregistration. Except that either (i) the simulated data were generated using that theory-minded model, and in that case checking that this matches is not a research question per se, but a prerequisite to the actual analysis and a sense check, or (ii) the simulations were generated using a different process, and in that case there might be something interesting to compare. However, it is very unclear from the manuscript what that is. I invite the authors to carefully reconsider whether that simulation brings anything to the manuscript.
In addition, I note that the authors analyse the simulated data (number of trials to reverse) assuming a Gaussian likelihood (line 178), where these are count data (probably more suited to Poisson/Negative-Binomial). As mentioned again and again in earlier reviews, this may or may not influence the interpretation in the end, but you can’t be sure without checking the data meet the likelihood’s assumptions.
2B: Most if not all the analyses are done in a Bayesian framework using Stan. Yet the authors do not give key details that should be provided with any such analyses, such as: the priors and why they were chosen; how did they check convergence and how; did they run posterior predictive checks… All of these have the potential to affect the validity of the inference (Gelman et al., 2020; McElreath, 2020); thus information on how they were done is needed. In particular, cursory reading of the code signals that priors were altered from the original choices: then, some explanation is needed either a minima to explain the final prior choice, a maxima to explain the initial priors, why they were bad, and why the final choice is better (I am in principle OK with the a minima option)
2C: the models used to estimate phi and lambda from the observed bird data are severely underdescribed (“2) Estimating 𝜙 and 𝜆 from the observed …”). In addition to all the issues in 2B: what is the likelihood (one could assume Normal, but see comment 2A)? Was one model fitted per bird, or was an overall mixed model fixed for all birds, with bird-specific random effects for phi and lambda (the code suggests the latter, as should be)? Was the correlation between phi and lambda at the bird level modelled explicitly or estimated later? When the authors say that were estimated separately for the beginning and the end of the experiment, is that “separate” as in “2 separate models”, or “separate” as in “we added a beginning/end factor effect”? Same for control vs manipulated? Why only use the first 2 and final 2 trials, and not the entire sequence? All of these questions need some form of answer in the manuscript, to be able to pass any judgment on the validity of the Results. Some of these answers seem to be in the attached code; they should also be in the manuscript.
2D: The third part of the analysis described in Methods is “3) Linking 𝜙 and 𝜆 from the observed serial reversal learning performances to the performance on the multi-access boxes”. It relies on using phi and lambda estimated from reversal trials to explain performance in the multi-access boxes. There is however a fundamental and potentially breaking issue here, based on the text provided: the authors seem to ignore uncertainty in the estimated phi and lambda. See “The values for 𝜙 and 𝜆 for each individual are estimated as the mean from 2000 samples from the posterior” (line 158), which is not contradicted by anything later on, and seems to be consistent with the code attached. It is well-known (see e.g. Houslay & Wilson, 2017 for a discussion in the context of behavioural syndromes), that this kind of “statistics-on-statistics” where error is ignored can lead to anticonservative analyses and wrong inferences, by inflating the degree of certainty we have about the underlying data points (here the phis and lambdas). Given individual estimated lambda and phi are going to be quite uncertain, given the limited data, this may likely be a very strong issue here.
Several options are available to accurately propagate uncertainty in phi and lambda. I present 3 below, but these are just the ones I am familiar with; other may be available:
- using a multivariate model combining the analyses in Methods 2) and Methods 3) in one single model, in which the phi and lambda act as the link between reversal and multi-box performance.
- Use measurement error models (see chapter 15 in (McElreath, 2020))
- Fit the model N times, one per posterior sample from the distribution of phis and lambdas obtained in Methods 2) and combine the posteriors. See (Nakagawa & De Villemereuil, 2019) for an application in the context of phylogenetic uncertainty. This has links to multiple imputation methods (https://cran.r-project.org/web/packages/brms/vignettes/brms_missings.html)
(Importantly, that issue about accurately conveying uncertainty also influences Figures 1,3 and potentially 2. Without information about posterior distribution, there is no way to know if any of the points/boxes on any of the panels are actually that different from each other, and thus no meaning to gain from the figure)
COMMENT 3
Line 216: The authors mention that phi and lambda are correlated. Did they consider the implications of this correlation (potential collinearity issues) when they included both in the models to explain multi-box performance?
I am also slightly worried about a comment in the linked code: “ line 473# Try different priors to reduce the correlation between estimated phis and lambdas”. If phis and lambdas really do have an interpretable biological meaning and do reflect two components of behavioural flexibility, it is also perfectly possible and natural for them to really be correlated.
COMMENT 4:
Continuing on the description of the multi-access data analysis: the mathematical description of the models (lines 224-227 and 233-237) are welcome, but they obfuscate what was done for most readers.
Consider that it is much clearer for the average reader, and just as accurate to simply write: “we fit a binomial* GLM(M) (logit** link) explaining the number of loci/4*** each individual solved in the multiaccess task by their phi and lambda estimated from the reversal learning data.” [replace by *negative-binomial, **log link, ***latency respectively for the 2nd model]. The exact math formulas can be given as supplementary material, including the prior specifications if the models were fitted in a Bayesian framework (which is unclear here).
COMMENT 5:
What is the rationale for using absolute deviations from the median phi/lambda? Why not the usual ways to test for non-linear and especially U-shaped relationships, such as quadratic terms for instance? Assuming the mention of using “ squared phi/lambda” refers to quadratic terms, (a) why not use only those as they are standard? (b) from the text the authors imply these models included only phi^2 and lambda^2 as explanatory variables, rather than phi, phi^2, lambda and lambda^2?
COMMENT 6:
There is a very large number of models provided in results (see Tables). This doesn’t match the Methods at all. From the methods as written (excluding the simulated data) there are only 3 basic models implied:
1-Estimating phi and lambda from reversal data (there may be more than one model here, see COMMENT 2C, but this can and arguably should be done in one model for all birds);
2 – locisolved in the multi-access test ~phi+lambda
3 – latency to solve the multi-access test ~phi+lambda
2 and 3 can of course be declined in several flavours based on whether you use linear/quadratic effects of phi or lambda (see COMMENT 5), but this doesn’t add up to the 40+ models presented. From what I understand, a large part of these models are reanalyses of the ones in Logan et al. I have several comments here:
are these models still in the new version of Logan et al?
do they actually need to be reanalysed to make your point?
If yes to any of these questions, why are they not described in more details? I would argue there are no way for the average intended reader to understand what each model in the Tables refers to (I cannot guarantee I do, despite having covered most of the review history of this project).
I strongly suggest the authors streamline their analyses to only include the 3 basic models I describe above (with the variations I also describe being possible). Alternately, the authors may want to include descriptions and rationale for each and every model they include in their Tables. In any case, including so many models without clear description or rationale, in a preprint that starts by a paragraph about the reproducibility crisis, is bound to attract judgment (see COMMENT 1)
COMMENT 7:
My comment about the validity of the now-Figure 4, from the original preprint, still stands: That figure implies causal links between the different items. And my criticisms about the underlying models (COMMENT 6) notwithstanding, it is clear that these models were not chosen based on a causal framework (from the number of models in Tables alone, but also from the text of the manuscript). I again repeat my advice to remove that figure, which is of no benefit for the manuscript, or to recontextualize it clearly.
COMMENT 8:
Following on COMMENT 2D, figure 5 should include measures of lambda and phi uncertainty to be informative
MINOR COMMENTS:
COMMENT 9:
The title as it stands is not informative on the content of the article, but only refers to a previous article.
COMMENT 10:
Abstract, lines 23-24: “flexibility” is repeated twice in one sentence
COMMENT 11:
Line 24-27 (and throughout the manuscript): the results of Logan et al are presented here in a very affirmative, general and certain way. Please remember that that paper is still under review and to adjust the language around it accordingly during revisions, especially since comments about the limited sample size and its impact on the generalisability of conclusions have been made repeatedly.
Line 51: As in the previous 2 manuscripts, the authors consistently assume the reader knows discipline-specific definitions, and either don’t present them, or present them too late/implicitly/as an afterthought. This is the case here for “behavioural flexibility”
COMMENT 12:
Throughout the manuscript, the authors cannot seem to agree whether to write “phi” and “lambda” or 𝜙 and 𝜆, sometimes alternating between Latin and Greek notation in a single paragraph.
COMMENT 13:
Comments about formatting that go back to the original manuscript have still not been taken into account. For instance, in Tables, there are many cases of missing spaces, missing colons, similar terms alternating between capitalized or not with no reason. The presentation of model terms does not make the table easy to read (no separation between lines referring to different models). One could also argue that “n_eff” should be directly written as “effective sample size” in the table, and that rather than writing “Rhat”, one should write in the actual “Rhat” symbol
COMMENT 14:
The citation for Stan is wrong: "(Team et al 2019)"(line 156); S.D. Team is not an author name; it should be Stan Development Team. This comments adds to my repeated comments here and in previous reviews about checking for correct formatting .
COMMENT 15:
The combined code for the analysis and manuscript is extremely long and dense, which makes it hard to parse. I would strongly to suggest to split it, first into manuscript code and analysis code (remember that you can always split a code in parts, and source() the code of a part into another, to make the latter shorter and easier to read), and then into sub-analysis code files. I acknowledge that it would be a daunting amount of work, so only suggest it. I note that the authors implicitly already do that splitting themselves, since they repeatedly re-call libraries and datasets at the start of each “chapter” of the code.
REFERENCES
Gelman, A., Vehtari, A., Simpson, D., Margossian, C. C., Carpenter, B., Yao, Y., Kennedy, L., Gabry, J., Bürkner, P.-C., & Modrák, M. (2020). Bayesian workflow. ArXiv. http://arxiv.org/abs/2011.01808
Houslay, T. M., & Wilson, A. J. (2017). Avoiding the misuse of BLUP in behavioural ecology. Behavioral Ecology, 28(4), Article 4. https://doi.org/10.1093/beheco/arx023
McElreath, R. (2020). Statistical rethinking: A Bayesian course with examples in R and Stan (2nd edition). Chapman and Hall/CRC.
Nakagawa, S., & De Villemereuil, P. (2019). A General Method for Simultaneously Accounting for Phylogenetic and Species Sampling Uncertainty via Rubin’s Rules in Comparative Analysis. Systematic Biology, 68(4), 632–641. https://doi.org/10.1093/sysbio/syy089
https://doi.org/10.24072/pci.ecology.100468.rev11


