
Assessing seasonality of tick abundance in different climatic regions
 based on reviews by 2 anonymous reviewers
Seasonality of host-seeking Ixodes ricinus nymph abundance in relation to climate
Abstract
Recommendation: posted 01 October 2023, validated 01 October 2023
Yoccoz, N. (2023) Assessing seasonality of tick abundance in different climatic regions. Peer Community in Ecology, 100507. https://doi.org/10.24072/pci.ecology.100507
Recommendation
Tick-borne pathogens are considered as one of the major threats to public health – Lyme borreliosis being a well-known example of such disease. Global change – from climate change to changes in land use or invasive species – is playing a role in the increased risk associated with these pathogens. An important aspect of our knowledge of ticks and their associated pathogens is seasonality – one component being the phenology of within-year tick occurrences. This is important both in terms of health risk – e.g., when is the risk of encountering ticks high – and ecological understanding, as tick dynamics may depend on the weather as well as different hosts with their own dynamics and habitat use.
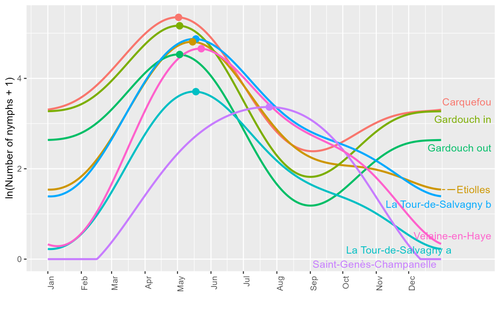
Hoch et al. (2023) provide a detailed data set on the phenology of one species of tick, Ixodes ricinus, in 6 different locations of France. Whereas relatively cool sites showed a clear peak in spring-summer, warmer sites showed in addition relatively high occurrences in fall-winter, with a minimum in late summer-early fall. Such results add robust data to the existing evidence of the importance of local climatic patterns for explaining tick phenology.
Recent analyses have shown that the phenology of Lyme borreliosis has been changing in northern Europe in the last 25 years, with seasonal peaks in cases occurring now 6 weeks earlier (Goren et al. 2023). The study by Hoch et al. (2023) is of too short duration to establish temporal changes in phenology (“only” 8 years, 2014-2021, see also Wongnak et al 2021 for some additional analyses; given the high year-to-year variability in weather, establishing phenological changes often require longer time series), and further work is needed to get better estimates of these changes and relate them to climate, land-use, and host density changes. Moreover, the phenology of ticks may also be related to species-specific tick phenology, and different tick species do not respond to current changes in identical ways (see for example differences between the two Ixodes species in Finland; Uusitalo et al. 2022). An efficient surveillance system requires therefore an adaptive monitoring design with regard to the tick species as well as the evolving causes of changes.
References
Goren, A., Viljugrein, H., Rivrud, I. M., Jore, S., Bakka, H., Vindenes, Y., & Mysterud, A. (2023). The emergence and shift in seasonality of Lyme borreliosis in Northern Europe. Proceedings of the Royal Society B: Biological Sciences, 290(1993), 20222420. https://doi.org/10.1098/rspb.2022.2420
Hoch, T., Madouasse, A., Jacquot, M., Wongnak, P., Beugnet, F., Bournez, L., . . . Agoulon, A. (2023). Seasonality of host-seeking Ixodes ricinus nymph abundance in relation to climate. bioRxiv, ver.4 peer-reviewed and recommended by Peer Community In Ecology. https://doi.org/10.1101/2022.07.25.501416
Uusitalo, R., Siljander, M., Lindén, A., Sormunen, J. J., Aalto, J., Hendrickx, G., . . . Vapalahti, O. (2022). Predicting habitat suitability for Ixodes ricinus and Ixodes persulcatus ticks in Finland. Parasites & Vectors, 15(1), 310. https://doi.org/10.1186/s13071-022-05410-8
Wongnak, P., Bord, S., Jacquot, M., Agoulon, A., Beugnet, F., Bournez, L., . . . Chalvet-Monfray, K. (2022). Meteorological and climatic variables predict the phenology of Ixodes ricinus nymph activity in France, accounting for habitat heterogeneity. Scientific Reports, 12(1), 7833. https://doi.org/10.1038/s41598-022-11479-z

The recommender in charge of the evaluation of the article and the reviewers declared that they have no conflict of interest (as defined in the code of conduct of PCI) with the authors or with the content of the article. The authors declared that they comply with the PCI rule of having no financial conflicts of interest in relation to the content of the article.
Tick observatories were supported by the CC-EID and Climatick projects: “Adaptation of Agriculture and Forests to Climate Change” metaprogramme of the French National Research Institute for Agriculture, Food and Environment (INRAE)
Evaluation round #2
DOI or URL of the preprint: https://doi.org/10.1101/2022.07.25.501416
Version of the preprint: 2
Author's Reply, 19 Sep 2023
Decision by Nigel Yoccoz, posted 18 Jul 2023, validated 18 Jul 2023
Dear Contributors to PCI Ecology,
You have accounted for most comments by the reviewers and myself, but there are some minor issues that need to be addressed.
When you write that you pooled years "in order to maximize the power of our estimation", this is not correct. One uses a statistical model that represents the processes generating the data - if there was a large variability between years, it would be wrong to ignore it, that is pooling the data would lead to a model underestimating the uncertainty (and for example leading to too small P-values or equivalently too narrow confidence intervals). You can argue that based on the data the variability between years is small and therefore the model provides a description of the general pattern, but one does not choose a model in order to get a small P-value. Note also that with respect to estimation, it is precision and/or accuracy which are relevant, power is with regards to hypothesis testing.
The equation of the model (l. 176 of the pdf) is still incorrect I believe. You write y_sd in the model equation and on the next line define y_st (same error with epsilon_sd and epsion_st). And the coefficients of the Fourier series are site specific? If not they would result in the same phenological pattern? Same comment with the variance of epsilon, it is site-specific?
I will wait for your response/changes to decide if I will recommend the manuscript - the suggested changes are relatively minor. If you still disagree with my suggestions, you need to provide a more thorough explanation.
Sincerely yours,
Nigel
Evaluation round #1
DOI or URL of the preprint: https://doi.org/10.1101/2022.07.25.501416
Version of the preprint: 1
Author's Reply, 29 Jun 2023
Decision by Nigel Yoccoz, posted 16 Mar 2023, validated 16 Mar 2023
Both reviewers provided important comments regarding in particular 1) the original contribution of this paper compared to Wongnak et al. (2022), as the same data are analysed but using a different statistical modelling approach, and 2) the lack of recent references and terminology regarding ticks and disease. Clarifying and revising these points will lead to an interesting contribution on the seasonality of tick behaviour and dynamics.
I will focus on the statistical analysis as I think it is quite central to your analysis. As one reviewer commented, you do not explain why you decided to use log-transformed data rather than the negative binomial as in Wongnak et al. (2022). There is some discussion regarding what is the best approach for analysing count data (see e.g. Ives 2015 for one point of view, and O’Hara et al. 2010 cited in Ives for another). One of the main differences is what the model predicts – the negative binomial model predicts the mean abundance (with a log link function), but the model based on the log-transformed data predicts the mean of the log-transformed value (which is different from the log of the mean values). You are most likely aware of the difference, but you would need then to explain the different modelling choices in the two papers. Moreover, as far as I can understand from your model described l. 169, you assume that the shape of the curve is the same every year (ie there is no effect of the year on the coefficients of the Fourier series – you must have include a site effect on the coefficient to allow site-specific shapes, right? You need to specify this in the equation). This may seem a reasonable approximation judging from Figure 2 (and it is probably what you mean when you mention a “typical “ year), but it is most likely to lead to a large underestimation of the uncertainty in the peak date (which you do not assess in this analyses). I understand that this might not be easy to implement (having different coefficients in different years will I believe result in a non-smooth function), but you should at least acknowledge this limitation of the model used.
In addition, I would also like to point out that the term “mountain” is defined internationally with respect to topography and not climate (you have climate belts such as the montane or alpine belts in some mountains, but this is a different issue, related to vegetation). Snethlage et al (2022) have provided the latest implementation of this international definition of mountains (it is the one developed by the Global Mountain Biodiversity Assessment, and used for example by other international organisations when investigating mountain regions; see eg Thornton et al. 2021, 2022) Clearly some areas defined in Joly’s paper as having a “mountainous” climate are not “mountains” according to the international definition. Please use another term that describe the climate characteristics and does not refer to “mountain”.
You need to provide more details regarding the weather stations used.
Ives, A. R. (2015). For testing the significance of regression coefficients, go ahead and log-transform count data. Methods in Ecology and Evolution, 6(7), 828-835. doi:10.1111/2041-210x.12386
Snethlage, M. A., Geschke, J., Ranipeta, A., Jetz, W., Yoccoz, N. G., Körner, C., . . . Urbach, D. (2022). A hierarchical inventory of the world’s mountains for global comparative mountain science. Scientific Data, 9(1), 149. doi:10.1038/s41597-022-01256-y
Thornton, J. M., Palazzi, E., Pepin, N. C., Cristofanelli, P., & Adler, C. (2021). Toward a definition of Essential Mountain Climate Variables. One Earth, 4(6), 805-827. doi:10.1016/j.oneear.2021.05.005
Thornton, J. M., Pepin, N., Shahgedanova, M., & Adler, C. (2022). Coverage of In Situ Climatological Observations in the World's Mountains. Frontiers in Climate, 4. doi:10.3389/fclim.2022.814181
Reviewed by anonymous reviewer 1, 04 Nov 2022
Reviewed by anonymous reviewer 2, 06 Mar 2023
Dear Authors,
Congratulations for the work done and thank you for your contribution. Hoch et al., describe the seasonal variations in I. ricinus ticks abundance according to different climatic habitats. The manuscript is well written, structured and critically discussed.
Below you find some minor comments to improve the manuscript.
Introduction section
L50: Please provide the brackets in the reference ‘(IPCC,2021)’
L64-66: I think you should use more updated references here since these refer to 20 years ago. In recent years, new evidence in the distributional changes of I. ricinus in Europe have been published. Please, consider the following references:
- Hvidsten D, Frafjord K, Gray JS, Henningsson AJ, Jenkins A, Kristiansen BE, Lager M, Rognerud B, Slåtsve AM, Stordal F, Stuen S, Wilhelmsson P. The distribution limit of the common tick, Ixodes ricinus, and some associated pathogens in north-western Europe. Ticks Tick Borne Dis. 2020 Jul;11(4):101388. doi: 10.1016/j.ttbdis.2020.101388
- Garcia-Vozmediano A, Krawczyk AI, Sprong H, Rossi L, Ramassa E, Tomassone L. Ticks climb the mountains: Ixodid tick infestation and infection by tick-borne pathogens in the Western Alps. Ticks Tick Borne Dis. 2020 Sep;11(5):101489. doi: 10.1016/j.ttbdis.2020.101489.
- De Pelsmaeker N, Korslund L, Steifetten Ø. High-elevational occurrence of two tick species, Ixodes ricinus and I. trianguliceps, at their northern distribution range. Parasit Vectors. 2021 Mar 18;14(1):161. doi: 10.1186/s13071-021-04604-w.
L80: The medical term is Lyme borreliosis, not Lyme disease. Please, correct it throughout the manuscript.
L99: Please revise the correct spelling of this citation
Results section
L193: Argasid ticks have nymphal instars, but not ixodids. I suggest you use just ‘nymphs’, please correct it throughout the manuscript.
L197: ‘between sites exhibiting different patterns’
Discussion section
L345-46: It is the first time you refer it. If this was evaluated, please provide some information about it in the Materials and methods section (how this was measure?). Was this evaluated in general? Did you check it for each sampling location? What kind of relation did you expected? Please, provide this in the supplementary materials. Saturation deficit has been well studied and determines the questing behaviour of I. ricinus (https://doi.org/10.1007/s004360000209). Some authors have described a non-linear relationship between saturation deficit and questing behaviour of nymphs (https://doi.org/10.1186/s13071-017-2112-x; https://doi.org/10.1186/s12898-017-0141-0). Do the measurements you collected enable the calculation of saturation deficit? Your findings could similarly support such relation, although the climatic variable employed in this study was not exactly the same the authors used, but correlated to it.
L361: ‘compared to’. Please correct with ‘compared with’
Reference section
Some references cited in the main text are missing in the reference section. Please, provide them accordingly. The references a refer to are the following:
- ‘Pérez-Eid, 2007’ used in L130
- ‘Wongnak et al, 2021’ used in L149-150
- Babenko (1958) (in Korenberg, 2000): I’m not sure about how this reference is cited in the main text (L293). Please, revise it if it is necessary
https://doi.org/10.24072/pci.ecology.100507.rev12


