
Environmental and functional determinants of tree performance in a neotropical forest: the imprint of evolutionary legacy on growth strategies
High intraspecific growth variability despite strong evolutionary heritage in a neotropical forest
Abstract
Recommendation: posted 07 June 2023, validated 07 June 2023
Munoz, F. (2023) Environmental and functional determinants of tree performance in a neotropical forest: the imprint of evolutionary legacy on growth strategies. Peer Community in Ecology, 100465. https://doi.org/10.24072/pci.ecology.100465
Recommendation
The hyperdiverse tropical forests have long fascinated ecologists because the fact that so many species persist at a low density at a local scale remains hard to explain. Both niche-based and neutral hypotheses have been tested, primarily based on analyzing the taxonomic composition of tropical forest plots (Janzen 1970; Hubbell 2001). Studies of the functional and phylogenetic structure of tropical tree communities have further aimed to better assess the importance of niche-based processes. For instance, Baraloto et al. (2012) found that co-occurring species were functionally and phylogenetically more similar in a neotropical forest, suggesting a role of environmental filtering. Likewise, Schmitt et al. (2021) found the influence of environmental filtering on the functional composition of an Indian rainforest. Yet these studies evidenced non-random trait-environment association based on the composition of assemblages only (in terms of occurrences and abundances). A major challenge remains to further address whether and how tree performance varies among species and individuals in tropical forests.
Functional traits are related to components of individual fitness (Violle et al. 2007). Recently, more and more emphasis has been put on examining the relationship between functional trait values and demographic parameters (Salguero-Gómez et al. 2018), in order to better understand how functional trait values determine species population dynamics and abundances in assemblages. Fortunel et al. (2018) found an influence of functional traits on species growth variation related to topography, and less clearly to neighborhood density (crowding). Poorter et al. (2018) observed 44% of trait variation within species in a neotropical forest. Although individual trait values would be expected to be better predictors of performance than average values measured at the species level, Poorter et al still found a poor relationship.
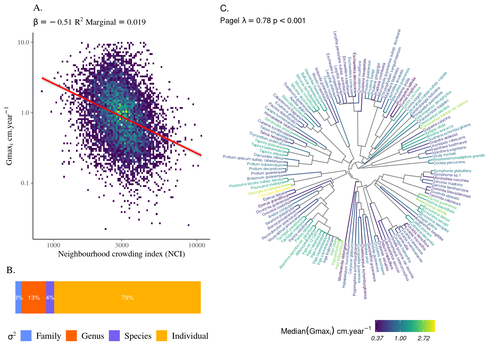
Schmitt et al. (2023) examined how abiotic conditions and biotic interactions (considering neighborhood density) influenced the variation of individual potential tree growth, in a tropical forest plot located in French Guiana. They also considered the link between species-averaged values of growth potential and functional traits. Schmitt et al. (2023) found substantial variation in growth potential within species, that functional traits explained 40% of the variation of species-averaged growth and, noticeably, that the taxonomic structure (used as random effect in their model) explained a third of the variation in individual growth.
Although functional traits of roots, wood and leaves could predict a significant part of species growth potential, much variability of tree growth occurred within species. Intraspecific trait variation can thus be huge in response to changing abiotic and biotic contexts across individuals. The information on phylogenetic relationships can still provide a proxy of the integrated phenotypic variation that is under selection across the phylogeny, and determine a variation in growth strategies among individuals. The similarity of the phylogenetic structure suggests a joint selection of these growth strategies and related functional traits during events of convergent evolution. Baraloto et al. (2012) already noted that phylogenetic distance can be a proxy of niche overlap in tropical tree communities. Here, Schmitt et al. further demonstrate that evolutionary heritage is significantly related to individual growth variation, and plead for better acknowledging this role in future studies.
While the role of fitness differences in tropical tree community dynamics remained to be assessed, the present study provides new evidence that individual growth does vary depending on evolutionary relationships, which can reflect the roles of selection and adaptation on growth strategies. Therefore, investigating both the influence of functional traits and phylogenetic relationships on individual performance remains a promising avenue of research, for functional and community ecology in general.
REFERENCES
Baraloto, Christopher, Olivier J. Hardy, C. E. Timothy Paine, Kyle G. Dexter, Corinne Cruaud, Luke T. Dunning, Mailyn-Adriana Gonzalez, et al. 2012. « Using functional traits and phylogenetic trees to examine the assembly of tropical tree communities ». Journal of Ecology, 100: 690‑701.
https://doi.org/10.1111/j.1365-2745.2012.01966.x
Fortunel Claire, Lasky Jesse R., Uriarte María, Valencia Renato, Wright S.Joseph, Garwood Nancy C., et Kraft Nathan J. B. 2018. « Topography and neighborhood crowding can interact to shape species growth and distribution in a diverse Amazonian forest ». Ecology, 99(10): 2272-2283. https://doi.org/10.1002/ecy.2441
Hubbell, S. P. 2001. The Unified Neutral Theory of Biodiversity and Biogeography. 1 vol. Princeton and Oxford: Princeton University Press. https://www.jstor.org/stable/j.ctt7rj8w
Janzen, Daniel H. 1970. « Herbivores and the number of tree species in tropical forests ». American Naturalist, 104(940): 501-528. https://doi.org/10.1086/282687
Poorter, Lourens, Carolina V. Castilho, Juliana Schietti, Rafael S. Oliveira, et Flávia R. C. Costa. 2018. « Can traits predict individual growth performance? A test in a hyperdiverse tropical forest ». New Phytologist, 219 (1): 109‑21. https://doi.org/10.1111/nph.15206
Salguero-Gómez, Roberto, Cyrille Violle, Olivier Gimenez, et Dylan Childs. 2018. « Delivering the promises of trait-based approaches to the needs of demographic approaches, and vice versa ». Functional Ecology, 32 (6): 1424‑35. https://doi.org/10.1111/1365-2435.13148
Schmitt, Sylvain, Valérie Raevel, Maxime Réjou‐Méchain, Narayanan Ayyappan, Natesan Balachandran, Narayanan Barathan, Gopalakrishnan Rajashekar, et François Munoz. 2021. « Canopy and understory tree guilds respond differently to the environment in an Indian rainforest ». Journal of Vegetation Science, e13075. https://doi.org/10.1111/jvs.13075
Sylvain Schmitt, Bruno Hérault, et Géraldine Derroire. 2023. « High intraspecific growth variability despite strong evolutionary heritage in a neotropical forest ». bioRxiv, 2022.07.27.501745, ver. 3 peer-reviewed and recommended by Peer Community in Ecology. https://doi.org/10.1101/2022.07.27.501745
Violle, C., M. L. Navas, D. Vile, E. Kazakou, C. Fortunel, I. Hummel, et E. Garnier. 2007. « Let the concept of trait be functional! » Oikos, 116(5), 882-892. https://doi.org/10.1111/j.0030-1299.2007.15559.x

The recommender in charge of the evaluation of the article and the reviewers declared that they have no conflict of interest (as defined in the code of conduct of PCI) with the authors or with the content of the article. The authors declared that they comply with the PCI rule of having no financial conflicts of interest in relation to the content of the article.
This research received no specific grant
Reviewed by David Murray-Stoker , 23 Mar 2023
The authors have made revisions that clarified their model selection procedure, including why their step procedure was necessary, and I have no further comments or suggestions to add. Overall, I think this is a solid contribution and further shows the importance of intraspecific variation for ecology and evolution.
David Murray-Stoker
Ph.D. Candidate
University of Toronto
https://doi.org/10.24072/pci.ecology.100465.rev31Reviewed by Jelena Pantel, 05 Apr 2023
Thanks to the authors for all of their edits, and effort to finetune an excellent study. I have read the responses, and am quite satisfied with this revised version.
https://doi.org/10.24072/pci.ecology.100465.rev32Evaluation round #2
DOI or URL of the preprint: https://doi.org/10.1101/2022.07.27.501745
Version of the preprint: 2
Author's Reply, 03 Mar 2023
Dear Editor,
Please find enclosed our revised version of our manuscript entitled “High intraspecific growth variability despite strong evolutionary heritage in a neotropical forest”, that we would like you to consider for recommendation in Peer Community In Ecology. We thank the three reviewers for their thorough comments on our manuscript. We believe that our revision in response to the comments has significantly improved the manuscript. We have particularly tried to clarify (i) how factors listed in the introduction eventually tie to the predictors included and (ii) what we meant by evolutionary heritage.
You will find below our responses to the reviewers’ comments, and in red in the attached file our changes to the previously submitted version of the manuscript. We hereby confirm that this work has not been published or accepted for publication, and is not under consideration for publication. Submission for recommendation has been approved by all co-authors and all persons entitled to authorship have been named.
Regarding PCI requirements, we plan to deposit corresponding GitHub code and supplementary information on Zenodo with DOIs as soon as the manuscript is accepted to avoid blocking too many DOIs for each version.
Yours sincerely,
Sylvain, Bruno, & Géraldine
Editor Comment
Dear authors,
3 reviewers have now provided their feedback on your preprint.
They and I much appreciate your work and answers to the previous reviews.
There is still room for improvement, and the reviewers provide valuable suggestions for that.
Therefore, we would appreciate it if you revise the manuscript and resubmit it.
Thank you for considering PCI Ecology for disseminating and promoting your work!
Best wishes,
François
Reviews
Reviewed by Camille Girard, 09 Feb 2023 13:26
Dear authors,
Thank you very much for your patience with my extensive review, for the changes that you made, and for your clear explanations. Your answers and changes are sufficient from my point of view.
> Thank you again for your previous in-depth review, and we are pleased that our answers were sufficient.
Just to discuss a little more, while I do not agree with your interpretation of Clark (2010, Science), it is - as you said in your response - one valid interpretation of the sentence of the abstract that you cited. The fact that you now cite Stump et al. (2021) provides another interpretation if the reader is interested, which is great. Moreover, please do not feel like you have to cite the Clark et al. 2022 preprint, which might need many changes before publication (although I obviously think it is an interesting complement to Clark 2010). Finally, the fact that "Intraspecific variability in performance can have strong implications for species coexistence" is already modulated by "can" in this sentence and I would not say it "remains an open question", but more that the nature of this variability can be discussed - but it really is a tiny detail that you do not have to take into account.
> Clark et al. 2022 seems very interesting for the question and we are happy to cite it, and we really wanted to emphasise the fact that the question is still open so that we are not just satisfied with the “can”.
Thank you again for your work and for this interesting discussion,
Good luck and kindest regards,
Camille.
Reviewed by Jelena Pantel, 18 Feb 2023 07:54
I appreciate the responses to the comments in my 1st revision.
> Thank you, we appreciate both your thorough reviews.
Point 1. The response to my Major Point 1 focuses primarily on pointing out to me, within the review, how the large variety of factors listed in the Introduction eventually tie to the predictors included in the models. Very little in the manuscript text itself is changed. My point remains that the manuscript text - as written - gives a very wide array of factors that can impact growth in Lines 45-131, then simply gives 3 predictors in Lines 133-136. The link from the Introduction to the predictors in the model is not clear. As a reader, after finishing the Introduction's first 4 paragraphs, I have no way to guess what will appear in the statistical model meant to address all the factors pointed out in the big, comprehensive introduction. The effort should be invested in the manuscript text not to highlight where, among the long lists of relevant factors, you mention the ones later tested - but instead to work from the top (large lists of factors that can impact growth) towards the bottom (the final list of factors included in *this* test). There is a gap from top to bottom. Imagine additional text that says "We can summarise the main types of factors that influence individual growth as X, Y, and Z. We developed proxies for each of these types of factors that were used to assess their relative importance for individual growth in our analysis. Proxy 1 evaluates X, as xxxxxx. Preoxy 2 evaluates Y, as xxxxxx. Proxy 3 evaluates Z, as xxxxxxx." There should be a case made for *how* each predictor encapsulates the main drivers of growth in the main text, that still lacks. I am not arguing that not enough predictors are included - the methods need not change. I am arguing that the text leaves no way for the reader to trust the model is adequate to predict individual growth, when numerous factors listed in the introduction are simply never mentioned again. I strongly advise the manuscript be revised to make this link crystal clear for the reader. I understand any reluctance to add text, but the first 4 paragraphs list many factors that are never mentioned again, and that is a challenge for the reader that I think should be addressed explicitly.
> We agree with you and have summarised all the factors towards environmental variables used and proxies in a revised paragraph: “Species strategies of resource use, and the functional traits used to study these strategies, are however still poor predictors of individual tree rates (Yang et al., 2018), partly because they ignore individual variation, and because critical aspects of demographic rates are not captured by most measured functional traits. Individual- and species-based approaches to functional traits are conceptually fundamentally different (Poorter et al., 2018): the species-based approach focuses on potential traits and rates and the individual-based approach focuses on realised traits and rates. Individual growth rates depend on access to resources, which are modulated by biotic interactions with neighbouring trees. Two environmental drivers can capture these interacting effects. (1) Topography is driving both water and nutrient availability in tropical forests through the dissolution of iron oxides, litter- and tree-fall transfers and waterlogging (Ferry et al., 2010; John et al., 2007). Therefore, individual growth within species is faster in valleys than on ridges in neotropical forests (Fortunel et al., 2018; but see O'Brien and Escudero 2021). (2) Neighbourhood crowding through competition for resources, including light, nutrients and water, but also potentially through facilitation, is known to modulate tree growth (Uriarte et al., 2004; Lewis and Tanner 2000). Individuals' responses to neighbourhood crowding depend on the species identity of the focal tree and the composition of its neighbours (Uriarte et al., 2004; Lewis and Tanner 2000). Neighbourhoods interact with other abiotic factors, e.g. growth is faster in bottomland than on higher ground, but neighbourhood crowding has a stronger negative effect on growth in bottomland than in higher ground for one in ten species (Fortunel et al., 2018). Neighbourhood crowding also captures the effect of forest gap dynamics, which is a key factor shaping the growth of individuals within species with increased tree growth near canopy openings (Hérault et al., 2010; Schmitt et al., 2022).”
Point 2. Line 117-118 also doesn't resolve the point I raised that 'evolutionary heritage' is treated as equal to phylogenetic signal. You acknowledge it was also a point of Discussion internally. None of the internal discussion nor the discussion in your response to my comment is injected into the manuscript text itself, and the light edit in lines 117-118 once again relies on the reader 'already knowing' how the author team views this term. It remains that it may be confusing for a reader. I once again recommend that the explanation should be given in the manuscript text itself (not to me in the response to reviews). For example you can include in Line 117 "This prevents assessing the relative contribution to individual growth variability of species evolutionary heritage (which we define here and use throughout the manuscript as the contribution of phylogenetic relatedness to XXX, similar as in Souza et al. 2016)". In other words, make the definition crystal clear. You use 'evolutionary heritage', evolutionary history, phylogeny, and phylogenetic signals interchangeably. I would suggest using one phrasing, define it very very explicitly, even if it takes a full sentence, and then continue to use that same / very similar phrasing throughout the manuscript. The use in Lines 117-118 differs from the use in Lines 146 and 151-152. If it was a point of discussion for the authors, and for me, then I would argue more care should be put to be clear about this in the manuscript text itself.
> We clarified as you suggested our use of evolutionary heritage in the beginning of the introduction: “This prevents assessing the relative contribution to individual growth variability of species evolutionary heritage (which we define here and throughout the manuscript as the contribution of phylogenetic relatedness to species phenotypic variation, following Souza et al., 2016) linked to phylogenetic background and individual adaptation and plasticity in response to local environments”.
Point 3. The addressing of the Bayesian growth model results was excellent, and also a nice inclusion for the manuscript. I appreciate this (and only note to resolve the y-axis labels in the very cool Figure S4). I also appreciate the point about the lack of phylogenetic signals and the informative Figure S10. Figure S5 is also very nice.
> Thank you, we are also very happy that, thanks to your review, this is now in the manuscript (with revised Fig. S4).
Reviewed by David Murray-Stoker, 23 Feb 2023 00:01
Schmitt et al. (bioRxiv 2022.07.27.501745, revision submitted to PCI Ecology) evaluated the importance of intraspecific variation for tree growth potential, in addition to evaluating for taxonomic and phylogenetic constraints. They found that most of the variation in growth potential occurred at the individual level, with phylogenetic conservatism in the responses. The authors also identified functional traits that predicted species’ growth potential. Overall, this is a compelling, large-scale study that emphasises the importance of intraspecific variation for ecological (and potentially evolutionary) patterns and processes. I have read the previous reviewers’ comments and the responses and revisions by the authors. I only have two main comments for the authors that I hope will be helpful.
1. Clarification of the step procedure for the species growth potential by functional trait models.
1.1 Lines 257-259: “We used a linear model with a step selection of the best model explaining species log-transformed growth potential with log-transformed functional traits to meet the normality assumptions (model 3).”
1.2 It is not clear to me what time of step procedure was used (e.g., forward, backward, or stepwise); however, any variant of stepwise selection can bias the model structure and, in turn, the resulting model parameters (Johnson & Omland, 2004; Whittingham et al., 2006; Grueber et al., 2011; Tredennick et al., 2021).
1.2.1 Forward selection successively adds significant terms while backward selection removes nonsignificant terms. Stepwise selection uses the general process of forward selection. Regardless of the exact procedure, this type of model selection can cause biases in slope estimates (either under- or over-estimating slopes based on a significance test) and relies on a single ‘best’ model from a larger suite of candidate models(Whittingham et al., 2006). While parameters were noted to be averaged over models (lines 259-260, see major comment 2), it is not clear if these models were statistically equivalent based on a set threshold for information-theoretic criteria (e.g., AIC, AICc, BIC) or just the adjusted R-squared of the model.
1.2.2 I would also generally advise against using any stepwise procedure and instead creating a candidate set of models based on the biology and knowledge of the system. From that candidate set, parameter estimates can be averaged.
1.2.2.1 I acknowledge that 19 functional traits can make this procedure prohibitive and why stepwise selection can seem more appealing.
1.3 For readers to have greater understanding and confidence in the results, the step model selection procedure should be clarified.
> We used default parameters resulting in a stepwise selection as now clarified in the manuscript: “We used a linear model with a step selection with stepwise direction of the best model explaining species log-transformed growth potential with log-transformed functional traits to meet the normality assumptions (model 3)”. As you have acknowledged, we have used 19 functional traits preventing easy selection based on biology and system knowledge.
2. Effects of model structure on relative importance of functional trait predictors.
2.1. Lines 259-260: “We measured functional traits relative importance in explaining
species growth potential averaging over orderings of regressors (Groemping,
2007).”
2.2. Linked to the model selection procedure, it was not clear how the relative
importance of predictor variables was averaged over the model(s). As the R-squared value is dependent on the sums-of-squares, the ordering of the terms in the model can affect the sums-of-squares (reviewed in Groemping 2007). Could the authors clarify how the order of terms in the model was controlled for when calculating relative importance?
2.2.1. I think specifying and briefly describing the metric within the `relaimpo`
package that was used would be helpful.
2.3. In addition to order of terms, it would be helpful to evaluate and then note any
correlations between traits included in the models that could affect their estimates
and relative importance (Groemping, 2007; Grueber et al., 2011).
> We used relaimpo::calc.relimp with default parameters and the lmg metric on the model after stepwise selection as now described in the manuscript: “We measured functional traits relative importance in explaining species growth potential after stepwise selection using the lmg metric. We used the R2 contribution averaged over orderings of regressors as in (Lindeman, Merenda and Gold 1980), using the function relimp from the relaimpo R package with default parameters (Groemping 2007).”.
I am only bringing up these 2 major points because I think the functional trait results are quite interesting, but I do think the methods should be clarified to make the results more robust.
> Thank you for your comments.
Decision by François Munoz, posted 23 Feb 2023, validated 23 Feb 2023
Dear authors,
3 reviewers have now provided their feedback on your preprint.
They and I much appreciate your work and answers to the previous reviews.
There is still room for improvement, and the reviewers provide valuable suggestions for that.
Therefore, we would appreciate that you revise the manuscript and resubmit it.
Thank you for considering PCI Ecology for disseminating and promoting your work!
Best wishes,
François
Reviewed by Camille Girard, 09 Feb 2023
Dear authors,
Thank you very much for your patience with my extensive review, for the changes that you made, and for your clear explanations.
Your answers and changes are sufficient from my point of view.
Just to discuss a little more, while I do not agree with your interpretation of Clark (2010, Science), it is - as you said in your response - one valid interpretation of the sentence of the abstract that you cited. The fact that you now cite Stump et al. (2021) provides another interpretation if the reader is interested, which is great. Moreover, please do not feel like you have to cite the Clark et al. 2022 preprint, which might need many changes before publication (although I obviously think it is an interesting complement to Clark 2010). Finally, the fact that "Intraspecific variability in performance can have strong implications for species coexistence" is already modulated by "can" in this sentence and I would not say it "remains an open question", but more that the nature of this variability can be discussed - but it really is a tiny detail that you do not have to take into account.
Thank you again for your work and for this interesting discussion,
Good luck and kindest regards,
Camille.
https://doi.org/10.24072/pci.ecology.100465.rev21Reviewed by Jelena Pantel, 18 Feb 2023
I appreciate the responses to the comments in my 1st revision.
Point 1. The response to my Major Point 1 focuses primarily on pointing out to me, within the review, how the large variety of factors listed in the Introduction eventually tie to the predictors included in the models. Very little in the manuscript text itself is changed. My point remains that the manuscript text - as written - gives a very wide array of factors that can impact growth in Lines 45-131, then simply gives 3 predictors in Lines 133-136. The link from the Introduction to the predictors in the model is not clear. As a reader, after finishing the Introduction's first 4 paragraphs, I have no way to guess what will appear in the statistical model meant to address all the factors pointed out in the big, comprehensive introduction.
The effort should be invested in the manuscript text not to highlight where, among the long lists of relevant factors, you mention the ones later tested - but instead to work from the top (large lists of factors that can impact growth) towards the bottom (the final list of factors included in *this* test). There is a gap from top to bottom. Imagine additional text that says "We can summarize the main types of factors that influence individual growth as X, Y, and Z. We developed proxies for each of these types of factors that were used to assess their relative importance for individual growth in our analysis. Proxy 1 evaluates X, as xxxxxx. Preoxy 2 evaluates Y, as xxxxxx. Proxy 3 evaluates Z, as xxxxxxx." There should be a case made for *how* each predictor encapsulates the main drivers of growth in the main text, that still lacks.
I am not arguing that not enough predictors are included - the methods need not change. I am arguing that the text leaves no way for the reader to trust the model is adequate to predict individual growth, when numerous factors listed in the introduction are simply never mentioned again. I strongly advise the manuscript be revised to make this link crystal clear for the reader. I understand ny reluctance to add text, but the first 4 paragraphs list many factors that are never mentioned again, and that is a challenge for the reader that I think should be addressed explicitly.
Point 2. Line 117-118 also doesn't resolve the point I raised that 'evolutionary heritage' is treated as equal to phylogenetic signal. You acknowledge it was also a point of Discussion internally. None of the internal discussion nor the discussion in your response to my comment is injected into the manuscript text itself, and the light edit in lines 117-118 once again relies on the reader 'already knowing' how the author team views this term. It remains that it may be confusing for a reader. I once again recommend that the explanation should be given in the manuscript text itself (not to me in the response to reviews). For example you can include in Line 117 "This prevents assessing the relative contribution to individual growth variability of species evolutionary heritage (which we define here and use throughout the manuscript as the contribution of phylogenetic relatedness to XXX, similar as in Souza et al. 2016)"
In other words, make the definition crystal clear. You use 'evolutionary heritage', evolutionary history, phylogeny, phylogenetic signal interchangeably. I would suggest to use one phrasing, define it very very explicitly, even if it takes a full sentence, and then continue to use that same / very similar phrasing throughout the manuscript. The use in Lines 117-118 differs from the use in Lines 146 and 151-152. If it was a point of discussion for the authors, and for me, then I would argue more care should be put to be clear about this in the manuscript text itself.
Point 3. The addressing of the Bayesian growth model results was excellent, and also a nice inclusion for the manuscript. I appreciate this (and only note to resolve the y-axis labels in the very cool Figure S4). I also appreciate the point about the lack of phylogenetic signal and the informative Figure S10. Figure S5 is also very nice.
https://doi.org/10.24072/pci.ecology.100465.rev22Reviewed by David Murray-Stoker, 23 Feb 2023
I have provided my review in the attached PDF.
-Reviewed by David Murray-Stoker (PhD Candidate, University of Toronto)
Download the review https://doi.org/10.24072/pci.ecology.100465.rev23Evaluation round #1
DOI or URL of the preprint: https://doi.org/10.1101/2022.07.27.501745
Version of the preprint: 1
Author's Reply, 23 Jan 2023
Dear Editor,
Please find enclosed our revised version of our manuscript entitled “High intraspecific growth variability despite strong evolutionary heritage in a neotropical forest”, that we would like you to consider for recommendation in Peer Community In Ecology. We thank the two reviewers for their thorough comments on our manuscript. We believe that our revision in response to the comments has significantly improved the manuscript. We have tried to clarify the introduction, and the text overall. We have also reported more information on the Bayesian inference of the growth model, including the goodness-of-fit with the new figure 1, and propagate the uncertainty from the individual growth model to the model with environmental and taxonomic covariates.
You will find below our responses to the reviewers’ comments, and in red in the attached file our changes to the previously submitted version of the manuscript. We hereby confirm that this work has not been published or accepted for publication, and is not under consideration for publication. Submission for recommendation has been approved by all co-authors and all persons entitled to authorship have been named.
Regarding PCI requirements, we plan to deposit corresponding GitHub code and supplementary information on Zenodo with DOIs as soon as the manuscript is accepted to avoid blocking too many DOIs for each version.
Yours sincerely,
Sylvain, Bruno, & Géraldine
Editor Comment
Dear authors,
Please accept my deepest apologies for the unusually long time of reviewing.
It has been most difficult to find the second reviewer, and there have been further delays due to informatic issues with the second review.
We have now received two detailed and insightful reviews of your manuscript.
Based on them and on my own reading, I think that your work is of interest and deserves publication, but still needs some substantial revision.
The reviewers have provided clear comments and recommendations that should guide you in the revision process.
We look forward to receiving a new version of the manuscript.
I will do my best to make the next reviewing round significantly quicker!
With best regards,
François
Reviews
Reviewed by Jelena Pantel, 26 Dec 2022 15:12
The manuscript uses an impressive dataset of individual-level growth and species-level functional traits to evaluate the role of phylogenetic background, individual-level variation, and environment for growth. The manuscript places the importance of their research in the context of gaining a much broader (compared to other studies with a smaller number of species included) insight into the importance of individual-level variation in growth across entire communities.
> Thank you very much for your thorough review and your enthusiasm.
I have 2 main points that are critical to address, followed by a few more minor points.
Major point 1. I struggled to place the broad array of factors reviewed in the Introduction in a broad, synthetic context. The authors review a really large variety of factors that can impact tree growth, and the linear model in the end has quite a small number of predictors relative to everything mentioned in the Introduction. I would expect one to lead to the other, but there is a tremendous gap here. In the end, the Introduction's list of factors (growth-mortality tradeoffs, species diameter & height, wood anatomy, hydraulic conductance, light interception / light & nutrient competition and the impacts of local environment for that access) isn't matched clearly to the factors actually included in the model. I request that a revision include a clearer path from the factors established as important in the Introduction to the indices (TWI,NCI) and predictors used in the explanatory model in the end. If these don't match, then it implies there are significant factors that impact species growth that weren't considered in this study.
> We recognise that the introduction was not clear enough and we hope that your comment, in conjunction with the comments of the second reviewer, will help to resolve this issue.
Taking into account the list of factors you described allows to organise the different factors influencing or related to growth:
1. growth-mortality tradeoffs participate in species ecological strategies
2. diameter & height are mainly linked to individual ontogeny, included in the growth model through the DBH effect
3. wood anatomy & hydraulic conductance are other phenotypic characteristics, i.e. functional traits, used to help predict species growth
4 light interception / light & nutrient competition and the impacts of local environment for that access are the actual environmental predictors that we later try to partly embrace with TWI and NCI
The three first paragraphs of the introduction were already structured following these points:
1. Ecological strategies & functional traits
2. Environmental determinants of species growth
3. Environmental determinants of individual growth & ontogeny
But we have tried to make this clear in the revised manuscript for clarity:
1. Ecological strategies: “Tree growth plays a major role in the ecological strategies of tree species”.
2. Functional traits: “To forecast the dynamics of tropical forests, efforts have been made to predict the growth of species. To this end, functional traits have been widely explored and used”.
3. Environmental determinants of species: “Multiple environmental determinants of species growth have already been identified, which in turn affect species distribution and shape community structure”.
4. Environmental determinants of individuals: “Nevertheless, access to light and nutrients, modulated by forest gap dynamics, topography and competition, also determines variation in individual growth within species over space and time”.
5. Ontogeny: “ Finally, individual tree growth varies also during its life with ontogeny (Hérault et al., 2011).”
Moreover, we tried to improve the link between the environmental drivers and the variables that we tested in the introduction and when presenting variables:
- “Locally, neighbourhood crowding is an indirect measure of light access and forest gap dynamics, while topography reflects the distribution of water and soil nutrients.”
- “We used the mean neighbourhood crowding index (NCI, Uriarte et al., 2004) over the last 30 years, an indirect measurement of access to light and forest gap dynamics for each individual.”
- “We used the topographic wetness index (TWI) as proxy of the distribution of soil water and nutrients in Paracou (Schmitt et al. 2021). Waterlogging and topography have been highlighted as crucial for forest dynamics (Ferry et al. 2010), species-habitat relationships (Engelbrecht et al. 2007), and phenotypic variation (Schmitt et al. 2020).“
Major point 2. The Bayesian hierarchical model for individual growth (Line 169-195) is interesting, but the results of the model were not included. This is crucial information to have, as the quality of the fit of the model to the data determines how useful the y-values included for each individual in the linear model of Table 1 are to represent an individual. Please include the results of that model fit in the manuscript.
> We totally agree and are sorry for not doing this in the initial version of this manuscript. The revised manuscript includes a description of the raw results from the Bayesian model for individual growth: “Bayesian inference of the individual growth model converged correctly (e.g., Fig. S1) with a good mixture of chains for most of the individual growth potentials (Gmaxi) shown with an Rhat<1.1 (99.2%, Fig. S2). The posteriors of the parameters did not show any correlation problems (e.g., Fig. S3). Posterior distributions of individual growth potentials showed limited uncertainty (e.g., Fig. S4). The resulting predicted diameters showed very good goodness of fit with a root mean square error of 0.43 centimetres (Fig. 1, illustrated for 90 individuals in 9 species in Fig. S5).”. This new description of results is accompanied by one new figure to illustrate the model goodness-of-fit and 5 supplementary figures to illustrate the correctness of the model.
Furthermore, the use of the Bayesian hierarchical model means there is some estimation of the uncertainty in the estimates for individual growth. Yet that information is not included in the models to explain the impacts of covariates (TWI, NCI, phylogeny), so it's not clear how these 2 fit together - in the end the ultimate goal of predicting individual growth is not reached. Have the authors considered including the predictors (Table 1) as covariates in the hierarchical Bayesian model for growth itself? Please explain why this step isn't taken, as it would be remarkable to see how the predictors impact the growth model, and to see model-predicted values for a random subset of species for a goodness of fit.
> We agree that it is not satisfying to rely on the accuracy of the first individual growth model and to use a single individual growth estimate in the second environmental effect model. However, we wanted the inference of the individual growth parameters to be independent of taxonomic and environmental structures to test their post-hoc effects. Consequently, instead of including environmental and taxonomic covariates hierarchically in the individual growth model, we now correctly propagate uncertainties in individual growth estimation: “We propagated the uncertainty in the estimation of individual growth (model 1) to the model testing the effect of phylogeny and environment (model 2). To do so, we considered the individual growth potentials obtained in 500 iterations of model 1 as 500 different dataset on which we fitted a Bayesian linear mixed model (model 2). For each of these dataset, we kept the 1000th iteration after a warm up of 999 iterations. We pooled all these last iterations to obtain a posterior distribution of the effect of phylogeny and environment that takes into account the uncertainty in individual growth potential.”. We thus reported in the updated manuscript the posterior distribution of environmental effects and taxonomy with credibility intervals (Table 1 and Fig. S6). The results are broadly similar with a slight increase in the uncertainty of the credibility intervals. As suggested, we additionally added model-predicted values for a random subset of species for a goodness of fit in figure S5.
3. Line 28 - can you find an alternative word for 'spatialized'? I presume that means simply that you have location information for each individual? For me it seems to imply something but I would prefer the authors are explicit about what that means.
> We replaced “spatialized” by “mapped” for clarity.
4. Line 46-49 - I really liked this justification for the importance of the study, and I think this addresses why my Major Point 2 above is important to consider.
> Thank you. Answered above.
5. Line 115 - I struggled with the wording of evolutionary heritage. I think the phrasing phylogenetic background might be more accurate? I want to make sure readers aren't surprised to read about evolutionary history but not see more information about e.g. local adaptation, species-specific genetic properties etc. I think it's fine to focus on phylogenetic signals, but that should be clearer sooner in the manuscript. I would not use the 'evolutionary heritage' or 'evolutionary background' phrasing (or at least define early how it's used in this study, what it doesn't include).
> Thanks for the comment, which we struggled with a bit and is still open to discussion. We used the term 'evolutionary inheritance' in a similar way to de Souza et al. 2016 PNAS to which we refer and which similarly described a phylogenetic signal in performance differences between tropical tree species. We have indeed focused on a phylogenetic signal, but we do not feel that the term 'evolutionary inheritance' implies a direct description of adaptive processes. We expect that differences in a key performance trait such as tree growth potential are not only not neutral, but depend in complex ways on multiple interacting gene loci. But this is not the subject of this manuscript. And we found the term "phylogenetic background" less clear to our general audience. Nevertheless, for the sake of clarity and as suggested, we have briefly defined how it is used in the study.
6. Line 132 - This is where I was struck by the large difference between the Introduction and the predictors, and where you can work to make the link clearer.
> Answered above.
7. Line 170 - I made a note to myself here to check the model, the fit of the model to the data etc, and as indicated in Major Point 1, that was not included. There should be a results section for this part of the Methods section.
> Answered above.
8. line 280 - Can the authors clarify why the individual-level and species-level (functional trait) analyses were done separately? If it's because the functional trait information was not available for all species in the individual-level dataset, can the authors please indicate the phylogenetic distribution of the 121 species ? In other words, if phylogenetic signals are important for growth at the species level, what can we learn from the functional trait analysis?
> As now described in the revised manuscript, we only had functional information for a reduced number of species: “We also tested the link between functional traits and species growth using the mean trait values of the 120 species that Vleminckx et al. (2021) shared with our study (over 138, Fig. S10).”. But this reduced dataset of species or the non-included species did not show any phylogenetic signal (Fig. S10).
Reviewed by Camille Girard, 24 Aug 2022 13:14
The scientific content of the article is interesting and straightforward, with stimulating discussions and perspectives for ecologists.
> Thank you very much for your kind words and in-depth review.
My main suggestions concern 1) the writing of the introduction, 2) a suggestion to discuss the proxies of environmental variables, and 3) the comments on Clark 2010 in the discussion. Otherwise, I have many minor comments on the phrasing or the presentation.
1) Introduction
Overall, all elements are interesting and justified but need to be better articulated; maybe using transition phrases between paragraphs and even sometimes between sentences.
I show below how I understood the discourse of the introduction to demonstrate how it could be made easier to follow for the reader.
First paragraph
1) Individual growth = determinant of species performance + driver of forest dynamics &
composition → understanding its determinants is important to predict the trajectories of tropical forests in the context of anthropogenic disturbances.
This first block is OK for me.
2) Tree growth plays a role in species ecological strategies through demographic trade-offs e.g. growth-mortality trade-offs → details about this trade-off.
OK but reformulate to make it smoother. For instance line 51 we need a transition to make it clear and elegant that you develop the growth-mortality trade-off you just introduced (for instance, “in this trade-offs, fast growing species...”).
> We improved the connection between the two sentences: “including a growth-mortality trade-off (Aubry-Kientz et al., 2015; Philipson et al., 2014; Wright et al., 2010). In the latter,”.
3) Efforts being made to forecast tropical forests dynamics by predicting the growth of species → functional traits → definition → expected to play a role in species growth → examples (wood density, max diameter, etc.)
I feel like this block needs small changes to be clearer. Here are some suggestions.
• l.54 I would add a connector like “hence”, and l.55 I would not repeat “to predict the growth
of species” e.g. “Hence, in order to forecast the dynamics of tropical species, efforts have been made to predict the growth of species. For this purpose, functional traits have been widely explored and used (refs).”
> We kindly rejected the suggestion of the “hence” because the sentence was not related to the growth-mortality trade-off, but we better connected the two sentences as suggested.
• l.57 syntax: “traits that impact fitness” OR “traits that have an impact on”.
> Thank you for the correction.
I would add “indeed” before the definition of functional traits
> We kindly reject this suggestion.
• l.58 remove “defined as” or change to “ individual performance i.e. ...”
> We kindly reject this suggestion as the individual performance is defined as such by Violle et al. (2007), but this could be questioned. So we prefer to keep defined here for clarity.
• l.59 change “functional traits” to “they”
> We prefer to keep functional traits for clarity.
• l.60 add “For instance”
> Done.
Second paragraph
• I feel like this second paragraph describes a second kind of “effort that has been made to
predict the growth of species”. Maybe you could clarify that you start a list? For instance by
breaking the first paragraph in two after l.55 (“Efforts have been made to predict the growth
of species”), or by adding “for instance” / “another trail” / “in parallel” /etc. each time you
develop another aspect of the exploration of the prediction of species growth?
> The second paragraph aimed to describe current knowledge on the environmental determinant of tree growth. We thus clarified the aim at the beginning as suggested: “Multiple environmental determinants of species growth have already been identified, which in turn affect species distribution and shape community structure.”.
• l.67 “The role of light has [notably or for instance] been ...”
> Done.
• l.74 it is unclear to me if you mean that the successional niches enable different species to
take turns, or if you are talking about natural selection that produced all these strategies.
> This is the former, sowe replaced “select” by “favour” for clarity.
• l.75 maybe precise that you consider the fast-slow continuum
> Not mandatorily, we prefer avoiding assuming that the species response to forest gap dynamics solely involves the fast-slow continuum.
• l.77 you say that soil also determines species distribution, but you did not talk explicitly
about species distribution earlier. Maybe precise that gap dynamics determines species
distributions in space and time? For instance by moving l.78 to the beginning “Species
distribution is also driven by environmental variables, shaping indirectly the structure of the
community.” and then develop light and soil.
> Done.
• I also feel like the whole paragraph focuses on light but you add soil (water and nutrients) at the end. Maybe you could make it obvious that the first paragraph (or second depending if you cut the first paragraph before detailing functional traits as suggested) is about species traits while the second is about the environmental determinants of species growth?
> Done.
Third paragraph
• Here you introduce intraspecific variability. To me it’s a crucial point of the introduction! I
would at least add a “However” (or “Nevertheless” to avoid repetition) to show that you
now shift perspective, or add “shifting on the individual level, ...”
> Done.
• l.85 I do not understand why you used “indeed”: are you making the supposition that,
because species functional traits are poor predictors of individual response, biotic and abiotic environmental aspects must play a role in it?
> As individuals vary within species, we can expect species level parameters to be poor predictors of individual tree performance as developed in Yang et al. (2018).
• l.87 do you have a reference?
> The reference is given and is Yang et al. (2018).
• l.89 “while the species-based approach..., the individual approach focuses” (do not forget
the second “focuses”).
> Done.
• l.90 to 110: you enumerate examples of ways individual growth can be mediated. Make that clear by announcing it before. For example you could use the phrase “There are many
factors shaping the growth of individuals within species” and then “notably/in particular gap
dynamics” or “an important one is gap dynamics”.
> The first sentence is exactly introducing the diversity of factors shaping individual growth, and “notably” is already included in the sentence on forest gap dynamics.
Fourth paragraph
The structure is OK for me.
• l.113 “for across”? Syntax problem here (I guess it is just “across”)
> Done.
• l.115 maybe change “and” to “,”
> We kindly reject this suggestion.
Fifth paragraph
This is cristal clear to me!
> Thank you very much.
2) A suggestion to discuss environmental proxies
l.363-369: could you (quickly) discuss the scale of the environmental variables vs. the individual scale (particularly for TWI although 1 m is a good resolution) + are your variables good proxies of local environmental conditions (particularly how good a proxy is elevation for plant water availability) + the effect of past environmental conditions that are not captured but impact the long- term growth strategy of the individual?
> This paragraph deals with evolutionary history and not environmental proxies, so we prefer to discuss them in the third dedicated paragraph. NCI is already defined at the individual scale (see material and methods). And a 1-m resolution seems fine enough to define an individual's micro-topography. So we do not feel useful discussing the scales. The relevance of the proxies are also presented in material and methods and discussed in the last paragraph.
3) About Clark 2010 and hypotheses on the effect of intraspecific variability on species coexistence
• You cite Clark (2010) but in you bibliography we find Clark et al. (2010, Ecological
Monographs), which is much longer and less “iconic”. I will now comment as if you really
meant Clark (2010, Science).
> Corrected.
• l.461-465: That is not Clark's main message. See Stump et al. (2021, Ecological Monographs) for a clear summary of the essence of Clark (2010). Clark (2010) on the contrary shows that although individuals within species apparently differ greatly in their performances, conspecifics still respond more similarly to environmental variation than heterospecifics. Observed intraspecific variation is merely the reflection of species’ high dimensional response to environmental variation. He does not present intraspecific variation as a mechanism enabling species coexistence; the only coexistence mechanism presented in his reflection framework is species differentiation in many niche dimensions coupled with biotic and abiotic environmental variation in many dimensions. The link with intraspecific vs. interspecific competition would not work otherwise: coexistence is stabilised because conspecifics respond more similarly than heterospecifics in the same environmental conditions, thus enabling higher intra- than interspecific competition, which stabilises coexistence (Chesson 2000).
> Clark (2010, Science) abstract literally states: “Variation among individuals within populations allows species to differ in their distributions of responses to the environment, despite the fact that the populations to which they belong do not differ, on average.” which we expressed by “Clark (2010) suggested that intraspecific variability allows species to differ in the distribution of their responses to the environment and thus to pass environmental filtering: an individual may persist in a given environment with a suitable phenotype while the same environment would have filtered out the average phenotype of the species.” This might not be the main message but this seems correct. As suggested, we already acknowledged the coexistence stabilising mechanisms proposed by Chesson (2000).
• However, Clark (2010) along with other pieces of work (Clark et al. 2010; Clark et al. 2007,
Ecology Letters) is often cited as a study showing a positive effect of intraspecific variability
on species coexistence (e.g. Hart et al. 2016, Ecology Letters; Uriarte et al. 2018, Ecology
Letters; Westerband; Funk and Barton 2021, Annals of Botany). This corpus has further been classified outside of niche theory, as "individual variation theory", which explicitly identifies intraspecific variation as the main driver of local diversity (Violle et al. 2012, Trends in Ecology and Evolution; Bastias et al. 2017, Plos One; Crawford et al. 2019, Oikos;
Westerband, Funk and Barton 2021). Yet, some other studies put this corpus back in the
context of niche multidimensionality (e.g. Le Bec et al. 2015, Plos One; Banitz 2019, Oikos;
Stump et al. 2021). Particularly, Stump et al. (2021) provide a clear summary of the core
concept of Clark (2010). Indeed, they understood that the paper "argued that species coexist
via high-dimensional niches, and proposed a test that used variability in growth and
reproduction between individuals to detect such species-level differences.", and that the
individual level "reveal species-level differences in the response to environmental variation."
• The hypothesis that intraspecific variability promotes coexistence by enabling local
competitive hierarchy inversions exists though, but is presented in other works like Fridley
et al. (2007, Journal of Ecology), Vieilledent et al. (2010, Oecologia) or more generally
neutral theory.
• You should maybe present other hypotheses or at least note that other hypotheses exist. An alternative hypothesis is that intraspecific variability leads to niche overlap (“blurs” species differences) which leads to competitive exclusion (harm species coexistence). However, the same effect could destabilise species coexistence, leading to neutral dynamics and therefore promote transient coexistence. See the introductions of Lichstein et al. (2007) and of Hart et al. (2016) to have a general understanding of these opposing hypotheses.
See also potentially Hart et al. (2016), Courbaud et al. (2012) and the synthesis of Stump et
al. (2021) on the effect of non-linear averaging.
> As suggested, we have added a reference to Stump et al. (2022) in the discussion. But we have not discussed further the mechanisms of coexistence as testing them is outside of the scope of the present manuscript. We have identified here a strong intraspecific variation in individual growth, which is only partially explained by the identified environmental factors. However the role of observed intraspecific variation in growth remains to be further explained/modelled to fit within the literature on coexistence that you suggested. We additionally included a reference to the preprint of Clark et al. (2022) to indicate to the reader that this remain an open question: “Intraspecific variability in performance can have strong implications for species coexistence (Chesson 2000, Clark 2010, see also Stump et al., 2022 for a synthesis), although this view remains an open question (e.g. Clark et al., 2022)”.
4) General remarks and details
General
• Make sure that the presentation of your references is homogeneous (et al. should be always in italics or always regular).
l.78 Kupers (you forgot the “s”), l.338 de Aguiar-Campos et al., 20201 (date problem)→
check all references, maybe using a reference manager like Zotero within Word or using
LateX/Rmarkdown reference system?
> Done.
• Control each item of you Bibliography: there are suspension points, squares in place of
special characters, the journal names are not always in italics, the doi url is sometimes
absent or is not highlighted as a url, there is a month (June).
> Done.
• Choose between British and American English: “-ised”, “-ise” (BE) or “-ized”, “ize”
(AE), “metres” or “meters”, “neighbour” or “neighbor”, etc.
> This is already in British but some words still finish in -ize depending on their origin (https://www.learnenglish.de/mistakes/isevsize.html).
• Search and replace double spaces, spaces before dots or after parentheses, absence of space after comma…
> Done.
• Use consistent separators for big numbers (commas like l.133 or spaces like l.252), and
make sure it is the case for all numbers above 999.
> Done.
• Justify text
> This automatically formatted afterwhile.
• Distinguish legend text from body text, and within legends distinguish the title.
> Legends are in italic and clearly inform the table and figure they are referring to, and we do not use titles for figures.
• Make the space between the same heading level and the text consistent (e.g.
Acknowledgments and Funding).
> This is automatic formatting from google doc which will be reformatted afterwhile.
Materials & Methods
Study site
OK
• l.151 Make sure one can say “in” the Guiana Shield (it could be “on” or “in the Guiana
Shield region”).
> Done.
Species and individuals
OK
• l.165 “and( iii)” → “and (iii)”
> Done.
Individual growth
• l.162 We first explored with a reduced dataset the best model shape → We first used a
reduced dataset to explore…
> Done.
• l.176 after describing verbally the model: maybe add “as detailed hereafter” (to reassure
readers who did not understand the sentence that everything will be explained). But that
could be inelegant.
> As the explanation follows in the next sentence, we kindly reject the suggestion.
• l.180 and 185 strange blank spaces after the sigmas
> Will be formatted afterwhile.
• l.188 H(i,t) → DBH(i,t)
> Done.
• in the two last formulas + l.189 change DBH0(i) to DBH(i,0) for consistency with DBH(i,t)
> We prefer to keep DBH0(i) which is a defined constant and not a variable here.
• l.189 maybe change “a model can be fitted to predict annual individual diameter DBH(i,t)
with observed diameter from censuses” to “a model can be fitted to observed diameters from
censuses using a Gaussian distribution in order to predict annual individual diameter
DBH(i,t) “
> We kindly reject this suggestion.
• l.190 “Guassian” → “Gaussian”
> Done.
• in the two last formulas: can you reduce the space between the sum and its content?
> This is automatic formatting of equations by google doc and will be reformatted afterwhile.
• l.193 “in particular individual growth potential” → Why in particular? Either develop or remove.
> This is indeed useless and was removed.
Descriptors of individual growth potential
1) NCI
• choose “20 m” or “20 metres” throughout the study
> Done.
• l.206 be consistent with the equation and choose between 0.25 and ¼.
> Done.
• l.206 I did not understand the explanation on the 0.25 parameter. Is it because 1/20 * ¼
approaches 1%? If not, you must explain for the “naive” reader who won’t look at the
reference. However, good job on explaining the choice of parameters!
> We detailed the 1% in the revised manuscript: “(i.e. exp(-¼ x 20) < 1%)”.
2) TWI
OK!
3) Functional traits
• l.210 is it plural (proxies)? If yes, be consistent throughout the study between “index”
(plural) and “ indices” (used later in your text). I personally find “indices” (or “indexes”)
disambiguating. If no, change to “as a proxy”.
> Done.
• l.217 “using the mean trait values”
> Done.
• l.218 “of Vleminckx” → “that Vleminckx” or “the 120 species Vleminckx et al. (2021) and
our study have in common / share”
> Done.
Analyses
The structure is very clear and helps following what you do.
However, I would expect you to refer to the questions at the end of your introduction. Not
necessarily to present the analyses following the same order, but perhaps precising which question you explore in each paragraph. Let me guess: first paragraph → question 3; second paragraph → question 1 (which makes me wonder if you should not be precise in your question 1 “tropical tree species”); third paragraph → question 2.
> We did not as one analysis can help answer several questions, and the other way around. For instance, the analysis from the first paragraph helps answer question 1 and 3, as introduced: “To study the effect of phylogeny and environment”.
1) Effect of phylogeny and environment on individual growth
• l.225 effect of phylogeny and environment→ on what? You say it right after but maybe
repeat “on individual growth”.
> We kindly reject the suggestion as this is indeed said in the sentence.
2) Species growth potential across phylogeny
• l.233 you did not describe the “log-normal distribution of individual growth potential within
species”, can you provide a Supplementary or refer to another paper?
> This is expected but we added a reference.
• l.233 the median as opposed to the mean?
> The median as in the lognormal distribution the median, the mean, and the mode are not confounded contrarily to normal distributions.
• I have no expertise on phylogeny and did not comment on the analyses you performed
concerning it.
3) Link between functional traits and species growth potential
• l.242 and 243 I do not mind, but some statisticians would want a justification on using log-
transformed data (to ensure normality of residuals / to refer to a linear framework...).
> We added “ to meet the normality assumptions”.
Results
I like that it follows the same structure as the analysis paragraph.
1)
• Refer to Fig. 1B for the taxonomic levels
> Done.
• l.256 “explains” → “explained”
> Done.
• l.259 and 261 Fig. 1A
> Done.
2)
• l.265 “phylogenetic autocorrelogram”→ “phylogenetic autocorrelograms”?
> Done.
• l.265 and 270 Fig. 1C
> Done.
3)
• l.279 “6” → “six”
> Done.
Table 1:
• Precise that “Residuals” is considered as variability “Among individuals within species” in
your results paragraph (and not just some measurement error).
> Done.
Figure 1:
• BEWARE, in the legend there are missing formulas!
> Sorry, this is an issue with automatic PDF conversion that we will try to avoid in resubmission to bioRxiv.
• Panel B: could you use a colour-blind friendly palette (like viridis magma or plasma to differ
from panels A and C)?
> Viridis magma or plasma are not colourblind-friendly, but we used the friendly_pal from R package ggpubfigs in the revised figure.
• Panel B: precise that you partition residual variance (you do not take into account the
variation explained by fixed effects)
> As described we partitioned the whole variation, as clarified now in the legend: “The partitioning of the variation of individual growth potential (Gmaxi) across taxonomy shows that most of the variation occurs at the individual (=0.72, Tab. 1), then genus (=0.12) before species (=0.04) and family (=0.03) levels”.
• Legend of B: needs to be re-written. Suggestion: “The variation of individual growth
potential shows most of the variation is explained at the individual level then by genus
before species and family.”
> We revised the legend: “The partitioning of the variation of individual growth potential (Gmaxi) across taxonomy shows that most of the variation occurs at the individual (=0.72, Tab. 1), then genus (=0.12) before species (=0.04) and family (=0.03) levels”.
• You cite Fig. S2 but you comment Fig. S1
> Done.
Table 2: OK (I like the presentation of your tables)
Discussion
Introductory paragraph
I like the quick results synthesis and the introduction of your main discussion themes.
• l.324-326: you say that forest gap dynamics resulted in fast-growing vs. slow-growing
strategies (by the way I would not say it results in fast/slow-growing trees but fast/slow-
growing strategies within trees), but it seems like you are still synthesising your results
while you already propose an explanation for this result, right? Make it obvious (could,
might...). Or if you refer to the fact that NCI plays a role in growth in your study, precise
that it is this observation that you connect to forest gap dynamics.
> We reformulated for clarity: “Nevertheless, at the individual tree level, the observed effect of neighbourhood crowding suggests that forest gap resulted in fast-growing trees in high light conditions with reduced competition, as opposed to slow-growing trees in low light conditions with strong competition”.
• l.329: these hyperdiverse ecosystems: I know you are referring to tropical forests, but you
did not precise this before and therefore “these” do not refer to anything. Maybe
“individuals in hyperdiverse ecosystems like tropical forests”?
> Done.
Evolutionary history shapes the growth of tropical trees
• l.350 individual variation in growth that is stronger than
> Done.
• l.353 “Several convergent evolution” can we say several evolutions (used l.408)? If yes,
then use plural. If not, maybe “convergent evolution events”.
> Done.
• I wonder if you could finish this part opening on the next one rather than the last one. You
could for instance say that as the species level seems relevant, understanding its functional
aspects seems to be a promising trail (as said by many functional ecologists before). You
would then keep the transition to individual variability for the end of the next paragraph,
though I think you have to keep the remarks of your current last sentence.
> We kindly reject the suggestion as this paragraph better connects with the last as pointed by the current last sentence.
Multiple functional dimensions together predict the species growth potential
• l.382 “shown as a major predictor” → “shown to be a major predictor”?
> Done.
• l.398 beware of the format of the reference
> It seems okay.
• I confirm that a transition is lacking to hop to the next paragraph.
• l.391: look up for instance Monique Weemstra (Miami), Kerstin Pierick (Göttingen),
Guangqi Zhang (Montpellier), I do not promise they did show this in the tropics but there are currently many people working on adapting the root economic spectrum to the tropics.
Individual growth potential is influenced by forest gap dynamics but remains largely unexplained
• l.415 and 472: you never defined CVlog before.
> We replaced it with plain text for clarity.
• l.421-422 replace “species” by “strategies” as you already precise that it’s at the interspecific level?
> We prefer to keep species and individuals everywhere to avoid any confusion. Strategies could be at any level.
• l.425 “niche successional-breadth” → “successional niche breadth”?
> Done.
• l.435 dynamics → result
> We kindly reject the suggestion as we deal here with the effect of the full succession from forest gap to closed canopy, while removing the term dynamics would imply only the effect of gap opening.
• l.437-439: To me it is a complicated sentence. You could cut the sentence rather than put “,
and” and remove “within species”. I think the reader understands at this point that you are
talking about individuals within species. I also wonder if you can say that you found that
slow-growing vs. fast growing species/individuals were in early vs. late succession niches.
That is an interpretation of the results with NCI rather than a result, isn’t it? Then I would
precise “we found...and interpreted this as....”.
> As suggested we split the sentence but kept within-species to avoid once again any confusion as we deal with multiple levels.
• l.445 “The role of topography on individual growth potential was weak” is redundant with
your previous sentences, you could go on with “We can however assume...”
> Indeed, but we kindly reject the suggestion as we prefer to keep it for clarity.
• l.450 remove “And”
> Done.
• l.451 “and other undetermined factors”?
> No, as forest gap dynamics here are determined.
• l.451 “remains also” → “also remains”
> Done.
• l.457 “shapes” → “shape” (also you do not want to attach it to “could”)
> Done.
• l.467 “supports” → “support”
> Done.
• l.469: I do not understand the link between the fact that late-successional species have more variable responses to competition and light variation on the one hand and the closure of the canopy during succession on the other hand. Indeed, late-successional species thrive in the already closed canopy. If you mean that the closed canopy offers more diverse light-
environments than an open canopy or a canopy that is starting to close, you should say it.
> We clarified the text in consequence: “In the case of forest gap dynamics, late-successional species have been shown to have more variation in response to competition and light variation than early-successional species (Peña-Claros et al., 2008; Hérault et al., 2010), which could be linked to a greater diversity of light and competitive environments”.
Supplementary materials
• I highly recommend to use PDF format to ensure that each reader can have access to all
elements in the document. For instance I could not see all the equations in Table 1.
• In Table 2, add “effects” (e.g. “Individual fixed” → “Individual fixed effect”) or use
abbreviations (FE and RE).
> Done.
• In Figure S2, could you precise what are NA data? Maybe it is a species that were not selected for the study? Or is it that there was not enough data to infer the indicator?
> The significance test concerns only the species level (tip of branches), the NA values concern the rest of branches that are not concerned by the significance test. This is now described in the figure legend.
• Figure S3: 99 or 999 bootstraps like the previous correlogram? You do not report
significance here although you comment it in the main text (l.281). Either do not comment
significance or provide the corresponding material (I think it’s okay if it means many
supplementary figures).
> To gain computing time only 99 bootstraps were used here as described. This is significant for short phylogenetic distance as shown by the confidence interval excluding null values.
Decision by François Munoz, posted 27 Dec 2022, validated 27 Dec 2022
Dear authors,
Please accept my deepest apologies for the unusually long time of reviewing.
It has been most difficult to find the second reviewer, and there have been further delay due to informatic issues with the second review.
We have now received two detailed and insightful reviews of your manuscript.
Based on them and on my own reading, I think that you work is of interest and deserves publication, but still needs some substantial revision.
The reviewers have provided clear comments and recommendation that should guide you in the revision process.
We look forward receiving a new version of the manuscript.
I will do my best to make the next reviewing round significantly quicker!
With best regards,
François
Reviewed by Camille Girard, 24 Aug 2022
Reviewed by Jelena Pantel, 26 Dec 2022
The manuscript uses an impressive dataset of indidivual-level growth and species-level functional traits to evalute the role of phylogenetic background, individual-level variation, and environment for growth. The mauscript places the importance of their research in the context of gaining a much broader (compared to other studies with a smaller number of species included) insight into the importance of individual-level variation in growth across entire communities.
I have 2 main points that are critical to address, followed by a few more minor points.
Major point 1. I struggled to place the broad array of factors reviewed in the Introduction in a broad, synthetic context. The authors review a really large variety of factors that can impact tree growth, and the linear model in the end has quite a small number of predictors relative to everything mentioned in the Introduction. I would expect one to lead to the other, but there is a tremendous gap here. In the end, the Introduction's list of factors (growth-mortality tradeoffs, species diameter & heught, wood anatomy, hydraulic conductance, light interception / light & nutrient competition and the impacts of local environment for that access) isn't matched clearly to the factors actually included in the model. I request that a revision include a clearer path from the factors established as important in the Introduction to the indices (TWI,NCI) and predictors used in the explanatory model in the end. If these don't match, then it implies there are significant factors that impact species growth that weren't considered in this study.
Major point 2. The Bayesian heirarchical model for individual growth (Line 169-195) is interesting, but the results of the model were not included. This is crucial information to have, as the quality of the fit of the model to the data determines how useful the y-values included for each indivodual in the linear model of Table 1 are to represent an individual. Please include the results of that model fit in the manuscript.
Furthermore, the use of the Bayesian heirarchical model means there is some estimation of the uncertainty in the estimates for individual growth. Yet that information is not included in the models to explain the impacts of covariates (TWI, NCI, phylogeny), so its not clear how these 2 fit together - in the end the ultimate goal of predicting individual growth is not reached. Have the authors considered including the predictors (Table 1) as covariates int the heirarchical Bayesian model for growth itself? Please explain why this step isn't taken, as it would be remarkable to see how the predictors impact the growth model, and to see model-predicted values for a random subset of species for a goodness of fit.
3. Line 28 - can you find an alternative word for 'spatialized'? I presume that means simply that you have location information for each individual? For me it seems to imply something but I would prefer the authors are explicit about what that means.
4. Line 46-49 - I really liked this justification for the importance of the study, and I think this addresses why my Major Point 2 above is important to consider.
5. Line 115 - I struggled with the wording of evolutionary heritage. I think the phrasing phylogenetic background might be more accurate? I want to make sure readers aren't surprised to read about evolutionary history but not see more information about e.g. local adaptation, species-specific genetic properties etc. I think its fine to focus on phylogenetic signal, but that should be clearer sooner in the manuscript. I would not use the 'evolutionary heritage' or 'evolutionary background' phrasing (or at least define early how its used in this study, what it doesn't include).
6. Line 132 - This is where I was struck by the large difference between the Introduction and the predictors, and where you can work to make the link clearer.
7. Line 170 - I made a note to myself here to check the model, the fit of the model to the data etc, and as indicated in Major Point 1, that was not incuded. There should be a results section for this part of the Methods section.
8. line 280 - Can the authors clarify why the individual-level and species-level (functional trait) analyses were done separately? If its because the functionnal trait information was not available for all species in the individual-level dataset, can the authors please indicate the phylogenetic distribution of the 121 species ? In other words, if phylogenetic signal is important for growth at the species level, what can we learn from the functional trait analysis?
https://doi.org/10.24072/pci.ecology.100465.rev12


