
Reassessment of French breeding bird population sizes: from citizen science observations to nationwide estimates
 based on reviews by 2 anonymous reviewers
Reassessment of French breeding bird population sizes using citizen science and accounting for species detectability
Abstract
Recommendation: posted 28 June 2024, validated 29 June 2024
Yoccoz, N. (2024) Reassessment of French breeding bird population sizes: from citizen science observations to nationwide estimates. Peer Community in Ecology, 100683. https://doi.org/10.24072/pci.ecology.100683
Recommendation
Estimating populations size of widespread, common species in a relatively large and heterogeneous country like France is difficult for several reasons, from having a sample covering well the diverse ecological gradients to accounting for detectability, the fact that absence of a species may represent a false negative, the species being present but not detected. Bird communities have been the focus of a very large number of studies, with some countries like the UK having long traditions of monitoring both common and rare species. Nabias et al. use a large, structured citizen science project to provide new estimates of common bird species, accounting for detectability and using different habitat and climate covariates to extrapolate abundance to non-sampled areas. About 2/3 of the species had estimates higher than what would have been expected using a previous attempt at estimating population size based in part on expert knowledge and projected using estimates of trends to the period covered by the citizen science sampling. Some species showed large differences between the two estimates, which could be in part explained by accounting for detectability.
This paper uses what is called model-based inference (as opposed to design-based inference, that uses the design to make inferences about the whole population; Buckland et al. 2000), both in terms of detectability and habitat suitability. The estimates obtained depend on how well the model components approximate the underlying processes, which in a complex dataset like this one is not easy to assess. But it clearly shows that detectability may have substantial implications for the population size estimates. This is of course not new but has rarely been done at this scale and using a large sample obtained on many species. Interesting further work could focus on testing the robustness of the model-based approach by for example sampling new plots and compare the expected values to the observed values. Such a sampling could be stratified to maximize the discrimination between expected low and high abundances, at least for species where the estimates might be considered as uncertain, or for which estimating population sizes is deemed important.
References
Buckland, S. T., Goudie, I. B. J., & Borchers, D. L. (2000). Wildlife Population Assessment: Past Developments and Future Directions. Biometrics, 56(1), 1-12. https://doi.org/10.1111/j.0006-341X.2000.00001.x
Nabias, J., Barbaro, L., Fontaine, B., Dupuy, J., Couzi, L., et al. (2024) Reassessment of French breeding bird population sizes using citizen science and accounting for species detectability. HAL, ver. 2 peer-reviewed and recommended by Peer Community in Ecology. https://hal.science/hal-04478371

The recommender in charge of the evaluation of the article and the reviewers declared that they have no conflict of interest (as defined in the code of conduct of PCI) with the authors or with the content of the article. The authors declared that they comply with the PCI rule of having no financial conflicts of interest in relation to the content of the article.
ANRT CIFRE 2021/0305
Evaluation round #1
DOI or URL of the preprint: https://hal.science/hal-04478371
Version of the preprint: 1
Author's Reply, 04 Jun 2024
We would like to deeply thank Prof. Yoccoz, for his interest in our study and his editorial work and two anonymous reviewers who provided invaluable insights and comments on the manuscript which greatly improved our initial work. We responded to all their general remarks and addressed their comments in the following document.
Decision by Nigel Yoccoz, posted 07 May 2024, validated 11 May 2024
Mr. Nabias
Two reviewers have carefully evaluated your paper, and the reviews are positive. They have provided many constructive comments, that will help you revise the paper. I concur with the reviewers that your analyses represent a nice case of hierarchical modelling.
Your paper is also a useful reminder that there can be a large uncertainty in population size estimates of common species in a country that is large and relatively heterogenous. As reviewer #2 wrote, the difference between the two estimates cannot be simply interpreted as a measure of bias, as your estimates using citizen science data do not represent the truth, they are likely to be biased even if less than the original method, so the real bias when comparing to the first estimates might be lower or higher than the one you refer to when writing "over/under-estimation". It is enough to mention the large differences in estimates between the two methods.
I was also wondering if there is any information available from other countries with bird monitoring schemes that could inform the estimates you discuss, particularly when there is a large discrepancy. I understand that it is hard to compare France to e.g. Germany, Spain or the UK, but it might be worthwhile for at least a few species to compare your estimates to those available elsewhere.
Best regards
Nigel Yoccoz
Reviewed by anonymous reviewer 1, 02 May 2024
This paper is at the interface between methodological development and applied ecology. While threatened or restricted-range species often benefit from exhaustive counts and surveys, monitoring common and widespread species is often neglected or poses significant challenges. In this context, citizen science (CS) emerges as a powerful tool for long-term monitoring, engaging volunteers to collect data across vast spatial scales. Despite the substantial increase in sampling efforts facilitated by CS, issues of detectability persist, potentially leading to the oversight of even common species in suitable habitats. This study draws on data from a large French CS program, EPOC-ODF, which amassed over 27,000 complete checklists across nearly 4,000 sites during the 2021-2023 breeding seasons. Using Hierarchical Distance Sampling (HDS), population size estimates were derived for 63 common bird species. Comparing these population size estimates to those from a previous expert-based atlas reveals significant underestimations in the atlas, likely due to conservative estimates. Some species with long-range songs were overestimated. The findings stress the importance of employing robust statistical methodologies to ensure unbiased ecological inferences and advocate for increased use of structured CS for biodiversity monitoring.
The manuscript is well-written, and the authors have managed to make it flow smoothly despite the multitude of in-depth analyses presented. The research question is quite clearly presented, and the different components of the article well linked to this question. The study's context is well-defined, elucidating the novelty the authors aim to underscore and the associated challenges. Note that I’m not an expert on the methods used in this paper nor citizen data analysis. Hence while some of my comments may be a bit naive, I believe they can be useful as other readers may share similar misunderstandings.
Although the methods used are quite innovative and present several advantages, the manuscript could highlight better a number of points regarding concerning the assumptions underlying the models and the associated methodological choices, that seem crucial and are not covered sufficiently at this stage in my opinion. The authors could also spell out in greater detail the limitations of their approach, which might lead them to be more cautious about their overall conclusions. With a view to improving our knowledge of abundances, which as the authors explain is a non-trivial issue, it seems important to make the reader aware that the approach can be further improved and the potential consequences.
General comments:
Results and discussion focus heavily on comparison with the old method, and perhaps too little on the current method. In particular, the probability of detection, which seems to me to be at the heart of this new approach, is not sufficiently discussed. Among other things, the influence of methodological choices and selected covariates is only very slightly addressed. In particular, I suggest expanding the bibliography on the subject. This is an example, but other could be used: Joshua H. Schmidt, Carol L. McIntyre, Margaret C. MacCluskie, Accounting for incomplete detection: What are we estimating and how might it affect long-term passerine monitoring programs?,Biological Conservation,Volume 160,2013, Pages 130-139,ISSN 0006-320.
Besides, I didn't quite understand how the different intra-annual replicates were incorporated into the model. I think I understood that they were linked to the probability of detection via the date and time of the survey, but I think this could be explained more clearly. If that's the case, why didn't the results section deal with the phenology of detection over the course of the season and the day, in order to suggest potential improvements to the protocol in the future, for example?
The authors go back and forth between the concepts of abundances and trends (and sometimes distribution) throughout the manuscript, leading to confusion on the part of the reader as to which specific question is being addressed by which part. Among other things, this led me to wonder about the differences between the EPOC-ODF program and the FBBS (that is quickly mentioned in the method part because used to extrapolate current abundances from ArGeom). I think that a sentence explaining all this might help the reader to understand why this approach is not directly compared in the article with the FBBS results.
The, I was a bit confused as for why the use of covariates is only mentioned from line 156 onwards. The latter seem important in the approach considered, and perhaps their use and what it implies should be mentioned earlier, particularly in terms of the precision they bring, or not, to detection modeling. In addition, their influence may deserve to be discussed in the discussion part: to what extent do these choices influence the estimates?
Finally, I believe results could be better organized and benefit from subsectioning. There are a lot of models and methods, and it was difficult for me to know what results were linked to what method. The result part is short, maybe some results about detection probabilities, and notably the different covariates relations could be added to then enrich the discussion. I also was wondering why the IC for detection probability is so small on Figure 5 and it means.
Specific comments:
I suggest rephrasing the subtitles to make it more explicit to help make reading easier (L156, 184, 220, 248, 276).
L67-69: Consider rephrase the sentence which as it stands is too vague. The second half is not entirely clear. Additionally, the link between "agricultural and planning policies" and bird abundances/trends has not been explained before.
L 106: What concrete criterion does "Medium" refer to?
L 125: quality of which aspect of inferences?
L 124: The objectives could be rephrased and further detailed in separate sentences. I wonder if it might be helpful to flip the sentence, starting with the objective "we propose an estimation method..." and then coming to the methods.
L 312: Breeding bird populations abundances and/or trends? I propose to clarify this point throughout the whole manuscript. I feel that the authors go back and forth between these notions, which can sometimes be confusing.
L142: « encountered » visually and/or singing?
L145: What is the surface of the square of the grid? Does it correspond to the point counts or is it used to set a round buffer?
L145: Perhaps add some information on why this choice of 5min, in light of the literature on the subject (5min sufficient for all species?).
L162: To this stage, we don’t know what the covariates were chosen for? Is this to model p or N. I feel this whole section is a bit confusing.
L 166: I didn’t understand this sentence when first reading the manuscript, only later when reading the part on modelling. I wonder if it could be rephrased somehow.
L168: Why chose to group water bodies and mineral surfaces? What ecological meaning justify this choice?
L172 and S3: It seems to me that Axis 1 is probably highly correlated with elevation, and maybe moisture as well. In a general way, I feel that covariate choices are not discussed enough. Could you discuss to what extent these choices influence results? What are the ecological hypotheses behind these choices? Perhaps you could discuss whether some bioclimatic covariates (wind?) could also be used to model detection?
Fig S3.1: This figure is extremely useful. Consider adding it to the main text?
L 174: Why 500m buffer radii? Scales and sampled surfaces are quite confusing in a general way. Maybe a figure illustrating/summarizing this could help?
L 180-182: I'm not entirely sure what is done here and how it is linked with previous paragraphs.
L189: Why 5 bin classes?
L191: I'm not sure if Julian date and hour are the effort covariates. I'm not quite sure which parameters they are incorporated into. Is it detection probability or also abundances?
L200-204: It might be helpful to consider cutting this sentence. Perhaps we could have one with the general case and then a second for the exceptions.
L213-218: Could you please clarify what these data from 2022 are and why they were not included in the whole analysis? It might be helpful to rephrase this section to make it more explicit.
L 272: Could you explain how you took account for it?
L 278-288: This section is quite complex to follow. It would be helpful to have more clarity on how you implemented this in your models.
L291: Could you please clarify what 14.84 refers to?
Figure 4: Point (2) is not very clear, what does extrapolation sign refer to?
L 356-358: Perhaps it would be helpful to be more explicit about what your hypothesis is about where these differences come from? If not species detection probabilities.
L365: Did the previous method also use covariates?
L362-368: This is an interesting point, but it might be clearer if it were rephrased slightly. In particular, it would be helpful to have more information about the effect of time and date on detection probabilities in the results section. It's not clear to me to what extent you're modelling the phenology of detection during spring.
L368-376: This paragraph could be in the introduction instead, because it presents the « old » method?
L381: I'm not quite sure what this means, but it sounds interesting. Perhaps you could try rephrasing it?
L 398: « Actually, community … » instead?
L421: This seems like an important point. It's not entirely clear how many species are concerned by this in your study. Could you please elaborate on how this affects your results?
https://doi.org/10.24072/pci.ecology.100683.rev11
Reviewed by anonymous reviewer 2, 30 Apr 2024
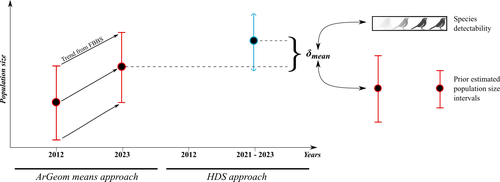
The paper compares estimates of abundance of common birds across France using two different atlas data sets. The first data set is a survey from 2012 for which abundance estimates were derived without statistical modelling. These estimates are then compared to estimates from a new atlas scheme for which the authors suggest hierarchical distance sampling (HDS) models to estimate abundance.
Considerable effort and thought have been put into the modelling process for the more recent data, with seemingly well considered choices regarding which covariates enter the different components of the HDS model.
The new atlas survey and how the hierarchical distance sampling model is used to estimate abundance is described in detail (although descriptions could sometimes be clearer, see below). However, given that the comparison between estimates from the previous survey and the new survey is the main focus, I’m missing sufficient detail about the previous scheme, especially as the main reference provided for it is in French. What was the statistical design of the previous survey, how were counts conducted, estimates derived etc? Estimates from the old survey are also described as expert based, but as currently described in the text it is just a quantitative computation from “measured abundance”, with no expert knowledge used in the process.
My main concern is otherwise that the authors claim without evidence that their estimates from the new scheme are better than those of the old one. For example, if estimates from the old survey are lower than those from the new survey, they are referred to as underestimating abundance (and vice versa). The assumption is that the modelling provides more accurate inference than the previous ad-hoc approach. This may seem reasonable, especially since the modelling is largely based on sound reasoning. But the fact is that since we don’t know the true abundances we do not known which estimates are closest to truth. A more nuanced discussion of the differences, not taking for granted that the HDS modelling will automatically provide better estimates is therefore necessary.
One concern, for instance, is that the N-mixture model used as one component of the HDS is not a very robust approach because essential information to estimate detection (availability in the HDS model) is missing (Barker et al. 2018). The N-mixture model can underestimate or overestimate abundance, it is not necessarily unbiased (e.g. Duarte 2018).
In addition to the above, I would suggest the authors to take another careful pass with the text. There is missing text in some places, new paragraphs where they are not needed etc. The Methods section could be improved for better clarity, and the Discussion better structured and more focused on the central questions.
Barker, R. J., Schofield, M. R., Link, W. A., & Sauer, J. R. (2018). On the reliability of N-mixture models for count data. Biometrics, 74(1), 369–377. https://doi.org/10.1111/biom.12734
Duarte, A., Adams, M. J., & Peterson, J. T. (2018). Fitting N-mixture models to count data with unmodeled heterogeneity: Bias, diagnostics, and alternative approaches. Ecological Modelling, 374, 51–59. https://doi.org/10.1016/j.ecolmodel.2018.02.007
Detailed comments;
Line 49-52. This is an example of a sentence that need to be more carefully worded. You have not shown that your estimates are unbiased.
L99. In Europe there are monitoring schemes specifically targeting common species though, it would be a bit of a stretch to say that they are neglected or overlooked.
L112-115. Should be the other way around? Geometric means are smaller than arithmetic means.
L130-130. There is in fact no test of whether the new data set provides estimate closer to the truth.
L174-175. Revise wording.
L187-188. Not quite clear what is meant here. Do you mean that you truncated distances above the 95% quantile to the 95% quantile?
L185-204. I would not be able to repeat the modelling process or model selection strategy from these explanations. Please try to revise the method description to improve clarity.
L185- Was the year of survey included in model somehow? Why, why not?
L205-208. Not clear how C-hat was defined or calculated.
L213. Clarify that you are assessing robustness of estimates to exclusion of one year of data (rather than general robustness).
L216-218. How do you draw the conclusion that estimates are robust to exclusion of one year when confidence intervals for 9 out of 30 species don’t overlap?
L233-234. Define “coefficient of variation of the range uncertainty between pre- and post-treatment estimates”.
L233-234. What about NT2 extrapolation?
L234. The pre- and post-treatment labels do not accurately convey what is done. Something like ‘outlier-trimmed’ and ‘untrimmed’ seems more appropriate.
L239. Which “comparison analysis”?
L249. → “comparable estimates between the old and the new survey, we restricted…”
L251-256. Remind the reader here that ArGeom estimates the number of breeding pairs.
L255-256. This could lead to errors though, since lack of sexual dimorphisms does not imply that males and females are equally likely to be detected.
L260. As the conclusion is that ArGeom provides lower estimates, it might be of interest to compare estimates using the upper bound in addition to the midpoint (just a suggestion).
L268. The notation “delta_methods” is somewhat unfortunate as the delta-method is a standard statistical approach not related to the use here.
L272-274. Not clear in what way you “took account of ArGeom uncertainty”.
L284-285. Revise wording in “using weighted means final candidate sets models in regards to AICc scores”.
L283-288. This analysis does not account for uncertainty in delta_methods. i.e. error in the estimate of delta is not accounted for.
L297. I suggest providing estimates of average estimated availability and detection probability in an appendix. This would be useful for understanding to what extent the N-mixture part inflates abundance, for example.
L308. “sits” → “its”.
L317 and elsewhere. Avoid qualifiers like “under” and “overestimation” and use something neutral like “estimated lower compared to HDS”.
L318. Why is habitat specialist/generalist a relevant variable for the difference between the two approaches? Was this based on a formal analysis?
L350-352. Here you are assuming that the HDS estimates are correctly representing truth.
L352. “presumed known uncertainties ranges” ?
L359-362. You found no association between detection probabilities and delta_methods, but still draw the conclusion that detection causes the difference? This needs further elaboration.
L369. “deviating from expert opinion reliance” - do you mean “derived from export opinion”?
L370-372. Difficult sentence.
L377-384. I had a hard time following the argument in this paragraph. Consider rephrasing.
L407-414. If conservation status was an important question, why is it not mentioned in the methods/results?
L421. What does “inferences of clustered individuals” mean?
Fig 5B-C. Explain what the figure shows. “Marginal” can mean many different things in a statistical context. I think the figure shows the predicted response across different values of detection probabilities while the other covariate is held constant (perhaps at its mean?)?
https://doi.org/10.24072/pci.ecology.100683.rev12


