
Recommendation
 based on reviews by Steffen Oppel and 1 anonymous reviewer
Most species are hard to observe, and different methods are required to estimate demographic parameters such as the number of young individuals produced (one measure of breeding success) and survival. In the former case, and in particular for birds of prey, it often relies upon direct observations of breeding pairs on their nests. Two problems can then occur, that some young are missed and therefore the breeding success is underestimated (“false negatives”), but it is also possible that because for example of the nest structure or vegetation surrounding the nest, more young birds than in fact are present are counted (“false positives”). Sollmann et al. (2024) address this problem by using data where the truth is known as each nest was also accessed after climbing the tree, and a hierarchical model accounting for both undercounts and overcounts. Finally, they assess the impact of this correction on projected population size using simulations.
This paper is a solid contribution to the panoply of methods and models that are available for monitoring populations, and has potential applications for many species for which both false positives and false negatives can be a problem. The results on the projected population sizes – showing that for growing populations correcting for bias can lead to large differences in population sizes after a few decades – may seem counterintuitive as population growth rate of long-lived species such as birds of prey is not very sensitive to a change in breeding success (as compared to adult survival). However, one should just be reminded that a small difference in population growth rate may translate to a large difference after many years – for example a growth rate of 1.05 after 50 years mean than population size is multiplied by 11.5, whereas a growth of 1.03 after 50 years mean a multiplication by 4.4, more than twice less individuals. Small differences may matter a lot if they are sustained, and a key aspect of management is to ensure that they are. Of course, management actions having an impact on survival may be more effective, but they might be harder to achieve than for example ensuring that birds of prey breed successfully.
References
Sollmann Rahel, Adenot Nathalie, Spakovszky Péter, Windt Jendrik, Mattsson Brady J. 2024. Accounting for observation biases associated with counts of young when estimating fecundity. bioRxiv, v. 2 peer-reviewed and recommended by Peer Community in Ecology. https://doi.org/10.1101/2023.12.01.569571
DOI or URL of the preprint: https://doi.org/10.1101/2023.12.01.569571
Version of the preprint: 1
, posted 16 Mar 2024, validated 19 Mar 2024Dear Dr. Sollmann,
Your paper on modeling observation biases when counting young has now been evaluated by two reviewers. They both found that the statistical modelling approach was a valuable contribution, but one reviewer pointed out that the population dynamic model (a matrix model) had one component missing - females that had 0 young in a given year and were therefore not included in the modelling of the counts of young. This should be easy to fix. The reviewer also suggested the use of a simpler correction factor. The other reviewer was also a bit sceptical about the impact of a 5% change in fecundity in a long-lived species as the red kite, but you should be able to answer this easily, for example on the basis of the revised simulations.
It is important to correct for observation biases, and your paper adds to the many tools already available. Most importantly, as also emphasized by the reviewers, the design of the study should make it possible to correct for such biases in an efficient way.
I look forward reading a revised version of your paper,
Regards
Nigel
, 17 Jan 2024Review of Accounting for observation biases associated with counts of young when estimating fecundity: case study on the arboreal-nesting red kite (Milvus milvus)
Sollmann Rahel, Adenot Nathalie, Spakovszky Péter, Windt Jendrik, Mattsson Brady J.
This manuscript provides a novel statistical modelling technique for estimating the number of fledglings in a nest when that number was imperfectly observed from the ground. In many bird, and especially raptor, monitoring schemes nests are observed from a distance and quantifying the exact number of chicks that grow up and fledge in each nest can be difficult, because chicks cannot be easily seen from available vantage points. Quantifying the number of offspring is however an important demographic parameter to understand and predict population dynamics, hence any attempt to control for observation bias is a welcome addition to the ecological toolbox.
This manuscript builds on multi-state modelling frameworks, which are well-established in the ecological literature to account for the imperfect detection process in wildlife surveys. These standard methods are extended to account also for false positive detections, where more chicks are counted than actually exist in a nest.
The model requires some calibration data, where a ground observation (prone to errors) is combined with a count of the true number of chicks (obtained by climbing to the nest, from a drone, or a camera), and these paired observations can then be used to estimate detection probability parameters, which can then be applied to further ground observation counts (where no validation data exist). Because nest access may not be possible for every population, the authors explore whether the fecundity between calibration nests and nests with only ground observations may differ, and provide a framework for their modelling approach to accommodate differing fecundities.
The performance of the model is tested with simulated data ranging from 10-250 nests to examine how large the observation bias is and how large the sample size needs to be for the model to retrieve unbiased estimates of truth (simulated data). Lastly, the authors explore how much a future population projection could deviate from truth if the fecundity estimated from imperfect ground observations was used instead of the actual true fecundity.
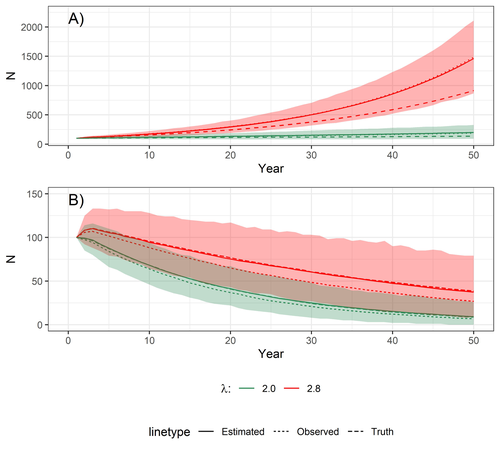
The manuscript is generally very well and clearly written and explains the rationale and the background for the methods in sufficient detail to be comprehensible and reproducible. The main conclusion from the study is that when accounting for the imperfect observation process the fecundity that is estimated could be higher than the fecundity derived from uncorrected observations, and that this difference could be large enough to substantially affect extrapolated population sizes 50 years in the future. The study has no fundamental critical flaws that invalidate the conclusions of the model estimating the ‘fecundity’ from imperfect ground observations, but I believe that the population projection has a critical flaw that could render the projections (Fig. 4A) biologically unrealistic. There are several aspects how the study could be improved to make it more widely applicable:
1) The population projection is based on a matrix population model for red kites, and the authors adopt the structure and some demographic parameters from an existing published model (Sergio et al. 2021) to explore how much future population sizes would differ between observed and actual fecundities. However, the ‘fecundity’ used in a population model is not the same as the ‘fecundity’ calculated in the model presented here to account for observation errors: the authors exclude all nests with 0 chicks, and for a population process all the females that either did not breed or did not succeed (and thus had 0 fledglings in a given year) need to be incorporated – but it is not clear how the ’fecundity’ presented in this manuscript (which is based on the subset of nests with >0 chicks) can adequately reflect the number of female offspring produced by a breeding female every year. According to the provided R code the number of nestlings produced is simply a random multinomial draw of the number of breeders and the probability vector of nests with 1,2,3, or 4 fledglings (which sum to 1) – the code therefore does not include any opportunity for a breeder to fail to raise offspring (which is biologically unrealistic). Note that the fecundity or productivity used in other Red Kite population models is generally <2 (Mammen et al. 2017, Katzenberger et al. 2021, Sergio et al. 2021, Pfeiffer and Schaub 2023), so the projections shown in this paper likely exaggerate the actual population trajectory that could be expected from a red kite population. This may not matter for the relative comparison of observed vs. estimated ‘fecundity’, but given that the discrepancy is larger for the rapidly growing population I suspect that this mis-specified ‘fecundity’ may therefore also slightly exaggerate the effect of accounting for observation error. This error could be easily fixed if the fledged brood size (termed ‘fecundity’ in this manuscript) is multiplied by a probability to fledge any young at all (0.81 based on (Mammen et al. 2017)) to arrive at a more realistic value for productivity in the population projection.
2) The model appears very complex, and is – in fact – too complex for the available data. This leads to a number of practical constraints that need to be imposed for the model to be identifiable (and an entire section on ‘problematic datasets’ that needed to be excluded, L. 263-284). Some of these constraints, while understandable, limit the utility of the model for a broader application beyond the presented case study. In particular, the constraint that all nests contain at least 1 chick is in my opinion a severe shortcoming for the broader applicability of the model. Although valid for the example study (where all nests are known a priori to contain at least one chick), the general case in nest monitoring will often include nests that have failed and contain 0 chicks, and the model should be able to incorporate such cases. Extensions such as those discussed (L. 450-458) are in my opinion not very promising, and the more commonly encountered scenarios in any monitoring (nest is empty and nothing can be seen, or not seeing any fledglings where the deviation can be >1) would be more valuable to be included.
3) Given the complexity outlined in (2), the authors miss the opportunity to use a very simple and basic correction factor to assess whether overall fecundity could be simply adjusted by this constant (rather than using a complex hierarchical model) with the same benefit than they claim to derive from the sophisticated model. If, for example, ground observations of the 26 paired calibration nests are divided by the actual number of chicks (from climb counts) in those nests, the resulting correction factor (0.95 from L. 312-313) could then simply be used to ‘correct’ all remaining ground counts. It would be very useful to include this ‘basic correction’ scenario in the comparison of population projections because it would be far easier to implement than the hierarchical model (especially for field practitioners). In return, more elaborate methods (such as those suggested in L. 476-480) could be removed from the manuscript.
4) The main benefit of the model is that it estimates the probability of observing the correct number of chicks. However, that probability will vary a lot based on nest location and local topography. While the authors acknowledge this as a ‘potential future extension’ (L. 469-476, 505-509), I think that this issue is actually more important than the scenario where they estimate detection probability from one population and then estimate ‘fecundity’ in another population, where ‘fecundity’ is different (but detection probability is constant). That scenario makes the possibly unrealistic assumption (L. 238 and 467: “assuming the classification process is the same.”) that detection probability is constant (or follows the same normal error distribution) between the two populations. Whether that assumption is realistic and likely to be met cannot be assessed without understanding the factors that affect the accuracy of chick counts. The recommendations to ensure that observation conditions are standardized are valid to a certain point, but in my opinion it is unrealistic to expect that anybody can standardize the “distance from the ground observer’s position to the young” (L. 486) because we cannot tell a red kite how high the tree is they prefer to nest in! Thus, it would be good to present nest-specific variables (nest height, tree density, slope etc.) that likely affect the accuracy of chick counts, and use the 26 nests with known true chick number to explore which factors actually explain any errors in ground counts. That sample size may not be sufficient to construct a linear predictor function in the model and estimate parameters that affect detection probability, but given that these nest-specific factors are likely the reason WHY there is a discrepancy between observed count and true state (=the premise for the entire study in the first place), this should be more prominently included in this manuscript rather than listed as a potential future extension. Including the detection process more formally may also facilitate other simplifications that have so far failed (e.g. L. 413-419 explains that a Poisson distribution did not work – but if the observation error could be modelled as a function of variables this approach may fit the data better?).
5) In many raptor monitoring projects, nests are visited more than once. Especially when the goal is to estimate fecundity, nests are often visited several times during a breeding season to ascertain the number of fledglings (Steenhof and Newton 2007). The authors point out in L. 443-448 that a Poisson-Poisson N-mixture model could work well for such data. While it may be beyond the scope of the current manuscript to demonstrate how well such a model would perform with repeated nest monitoring data, it would be good to add some thoughts to this part of the Discussion how the closure assumption could be met in these models: nests can fail at any time (although the probability often decreases as chicks get older), and repeated visits may therefore encounter an altered true state of the number of chicks in the nest (which may violate a core assumption of N-mixture models?). In the current case study observations are made at a single point in time, which is a typical process in basic monitoring schemes that count the number of almost fully-grown chicks just prior to fledging (Steenhof and Newton 2007). However, such observations would almost always include 0 counts (where nests had failed), which is not envisioned in the current study (see point (2) above), and a better explanation under what monitoring scheme the described model could actually be applied would be useful (unless it is expanded to allow for nest failures and 0 counts).
6) The opportunity to use drones for accurate nest surveys is only briefly mentioned in the manuscript (L. 76) but given the cheap and ubiquitous availability of drones and expanding literature on how to use drones for wildlife monitoring (Chabot and Francis 2016, Brack et al. 2018, Hodgson et al. 2018, Edney and Wood 2021, Zink et al. 2023) I think it would be reasonable to suggest that using a drone could achieve the same certainty as a climber with less effort, potentially eliminating the need for an observation-correction or at least allowing for a much larger sample size.
The Swiss Ornithological Institute (where I work) could contribute much more data for the extension or evaluation of those models. Please contact us if you would like more data from nests where the number of chicks was validated by either drone or climb counts.
Steffen Oppel
Literature cited:
Brack, I. V., Kindel, A. and Oliveira, L. F. B. 2018. Detection errors in wildlife abundance estimates from Unmanned Aerial Systems (UAS) surveys: Synthesis, solutions, and challenges. – Methods in Ecology and Evolution 9: 1864-1873.
Chabot, D. and Francis, C. M. 2016. Computer-automated bird detection and counts in high-resolution aerial images: a review. – Journal of Field Ornithology 87: 343-359.
Edney, A. J. and Wood, M. J. 2021. Applications of digital imaging and analysis in seabird monitoring and research. – Ibis 163: 317-337.
Hodgson, J. C., Mott, R., Baylis, S. M., Pham, T. T., Wotherspoon, S., Kilpatrick, A. D., Raja, S. R., Reid, I., Terauds, A. and Koh, L. P. 2018. Drones count wildlife more accurately and precisely than humans. – Methods in Ecology and Evolution 9: 1160-1167.
Katzenberger, J., Gottschalk, E., Balkenhol, N. and Waltert, M. 2021. Density-dependent age of first reproduction as a key factor for population dynamics: stable breeding populations mask strong floater declines in a long-lived raptor. – Animal Conservation 24: 862-875.
Mammen, U., Stark, I. and Stubbe, M. 2017. Reproduktionsparameter der Greifvögel und Eulen Deutschlands von 1988 bis 2012 Reproduction parameters of birds of prey and owls in Germany from 1988 to 2012. – Populationsökologie Greifvögel- und Eulenarten 7: 9-28.
Pfeiffer, T. and Schaub, M. 2023. Productivity drives the dynamics of a red kite source population that depends on immigration. – Journal of Avian Biology 2023: e02984.
Sergio, F., Tavecchia, G., Blas, J., Tanferna, A. and Hiraldo, F. 2021. Demographic modeling to fine-tune conservation targets: importance of pre-adults for the decline of an endangered raptor. – Ecological Applications 31: e2266.
Steenhof, K. and Newton, I. 2007. Assessing nesting success and productivity. – In: Bird, D. M. and Bildstein, K. L. (eds.) Raptor research and management techniques. Hancock House, Surrey, BC, Canada, pp. 181-192.
Zink, R., Kmetova-Biro, E., Agnezy, S., Klisurov, I. and Margalida, A. 2023. Assessing the potential disturbance effects on the use of Unmanned Aircraft Systems (UASs) for European vultures research: a review and conservation recommendations. – Bird Conservation International 33: e45.
https://doi.org/10.24072/pci.ecology.100632.rev11
Does the title clearly reflect the content of the article? Yes,
Does the abstract present the main findings of the study? Yes
Are the research questions/hypotheses/predictions clearly presented? Yes
Does the introduction build on relevant research in the field? Yes
Are the methods and analyses sufficiently detailed to allow replication by other researchers? No. Need some more detailes on the simulations
Are the methods and statistical analyses appropriate and well described? Yes
In the case of negative results, is there a statistical power analysis (or an adequate Bayesian analysis or equivalence testing)? NA
Are the results described and interpreted correctly? Yes
Have the authors appropriately emphasized the strengths and limitations of their study/theory/methods/argument? Yes
Are the conclusions adequately supported by the results (without overstating the implications of the findings)? Yes
I have mixed comments about this work. On one hand the method is interesting. It has been described clearly and it has several possible applications. It is not completely novel though. It roots in N-mixture models and occupancy models accounting for false positives. Differently from this class of models, the one presented here does not need repeated measures, but it does need some true values to account for the uncertainty in the dataset. It is also interesting the insight on parameter redundancy and the use of the calibration methods with unbiased data. Simulations are used to prove model reliability and to answer specific questions on model performance. On the other hand, I think the case study, i.e the illustration of the method, is weak. The application is based on a small dataset. The bias of considering unadjusted counts is negligible, especially in long-lived species, which fecundity has a low elasticity on population growth rate. I consider a bias of 1 offspring in either direction (one less or one more) as negligible. Especially because it is more pronounced in larger broods and because positive biases seem to compensate negative ones. A smaller bias on adult survival probability would have a more serious impact on population dynamics. This is even less important if one considered that about ¾ of the nests were not affected by the bias (19/26). The part on population projections is also on a shaking ground. First, the consequence of a lower fertility can be calculated analytically using elasticity or sensitivity of the fecundity, which is available in the literature or in the COMADRE dataset, for the same and/or very close species. Second it assumes that i) biases do not depend on observers or habitat and ii) are constant over time. Moreover, the bias is more important when the population is increasing, a situation of least concern in recovering populations. Finally, a very minor point. If nests (or a subsample of them) are climbed to mark chicks and obtained the calibration data, the bias would concern few nests anyway (here only 27% of them). In species or populations with inaccessible nests model parameters are redundant and the method cannot be applied. This is a minor point because obviously it depends on the study system and it does not influence the model.
The methods are generally clear, but the simulation part would benefit from more explanations. Possibly a table with dataset characteristics used in each question. For example, in paired datasets with n=10, 25…250 it is not clear if 100% of the datasets is paired or whether the truths concern only an increasing proportion of the datasets.
Some specific points:
Lines 96. An alternative method, not mentioned here is the double-observer counts (e.g. Nihcols et al. 2000 The Auk 117(2):393–408, 2000; Williams et al.,2002 Analysis and Management of Animal Populations. Academic Press. San Diego, CA). In this method there is no need for repeated visits, nor to have a subset of paired counts to make the number of chicks estimable. It is based on the data from two observers that count animals independently.
Lines 110. Please specify the total number of nests in the dataset. It should be 26 (8 in 2021 and 18 in 2022), is it correct? Do model parameters change between the year? Normally one is interested in a yearly value of fecundity, which stratified the 26 nests even more.
Lines 134. This reads as a contradiction. If there is a 1 plus- 1 minus bias in the number of chicks, the classification of an occupied nest based on the observation of at least one chick, is potentially biased as well. The authors inform the reader that the model could be expanded to account for observed empty nests, but I wonder why it has not been done here.
Lines 263. Due to problematic datasets, it is difficult to have a clear picture of the simulated set of data retained. Would it be possible to add a Table with the simulated vs retained datasets and they characteristics for each question posed?
Line 498. Not always. In short-lived species, only. The population of many long-lived species are not affected by a 5% change in fecundity.
In conclusions, I liked the idea and the formulation of the model, but I do not find the illustration very useful. In real dataset, the SE of fecundity measure includes a 5% bias. Stochastic projections that account for parameter uncertainty would probably include the 5% bias in a parameter with low elasticity.
I do not see anything fundamentally wrong with this work beside the weak biological realism of the example.
https://doi.org/10.24072/pci.ecology.100632.rev12
