
Recommendation
Individuals ability to withstand abiotic and biotic stresses is crucial to the maintenance of populations at climate edge of tree species distribution. We start to have a detailed understanding of tree growth response and to a lesser extent mortality response in these populations. In contrast, our understanding of the response of tree fecundity and recruitment remains limited because of the difficulty to monitor it at the individual tree level in the field. Tree recruitment limitation is, however, crucial for tree population dynamics [1-2].
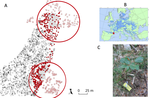
In their study Oddou-Muratorio et al. [3] use a new method that they recently developed that jointly estimate male and female effective fecundity in natural populations using naturally established seedlings [4]. Their method uses a spatially explicit Bayesian analysis based on molecular markers and parentage analyses (MEMM program [4]). They apply this method to an unmanaged Beech forest at the southern edge of Beech distribution, where tree defoliation – taken as an integrative indicator of tree abiotic and biotic stress – and growth have been monitored for all adult trees.
This allows the authors to explore alternative hypothesis about tree fecundity response to stress. In one hand, biotic and abiotic stresses are thought to negatively impact tree fecundity. In the other hand, management and studies of orchard fruit tree support the idea that stress could trigger a compensatory increase of fecundity at the cost of other performances such as growth and survival.
They show that both growth and female fecundity are negatively affected by defoliation. There was no evidence that stresses trigger a compensatory increase of fecundity. Yet, they also found that, for large highly defoliated trees, there was a trade-off between growth and female fecundity. Some individuals are able to mitigate stress impact on fecundity by decreasing their growth. It is difficult to understand with available data what is driving such divergent responses between defoliated individuals. This could be related to differences in micro-environmental conditions or genetic background of individual trees. Such individual-level difference in response to stress could be crucial to understand tree populations response to ongoing climate change. This study clearly opens exciting new perspectives to apply such new methods to understand the role of fecundity on tree population dynamics. For instance, could we apply this method across the species distribution to understand how effective fecundity and its response to abiotic stress change between southern edge populations, core populations, and northern edge populations? Using time-series retrieved from such analysis can we disentangle the effect of different climatic drivers? It would also be interesting to see how such results can contribute to analyses covering the full tree life cycle to understand the contribution of fecundity response to population and evolutionary.
References
[1] Clark, J. S. et al. (1999). Interpreting recruitment limitation in forests. American Journal of Botany, 86(1), 1-16. doi: 10.2307/2656950
[2] Petit, R. J., and Hampe, A. (2006). Some evolutionary consequences of being a tree. Annu. Rev. Ecol. Evol. Syst., 37, 187-214. doi: 10.1146/annurev.ecolsys.37.091305.110215
[3] Oddou-Muratorio, S., Petit, C., Journe, V., Lingrand, M., Magdalou, J. A., Hurson, C., Garrigue, J., Davi, H. and Magnanou, E. (2019). Crown defoliation decreases reproduction and wood growth in a marginal European beech population. bioRxiv, 474874, ver. 4 peer-reviewed and recommended by PCI Ecology. doi: 10.1101/474874
[4] Oddou‐Muratorio, S. and Klein, E. K. (2008). Comparing direct vs. indirect estimates of gene flow within a population of a scattered tree species. Molecular Ecology, 17(11), 2743-2754. doi: 10.1111/j.1365-294X.2008.03783.x
DOI or URL of the preprint: https://doi.org/10.1101/474874
Dear Editor Please find enclosed the manuscript entitled “Live and let reproduce: Crown defoliation decreases reproduction and wood growth in a marginal European beech population”. This is the final revision of the manuscript which received a “Minor revision” decision after a second round of review by one editor and one recommender of PCIEcology on the 11th of October 2019. We addressed most of the short suggestions of the editor: The introduction was shortened as suggested: we removed Lines 56 – 61 and Lines 71-73 (previous version of the preprint). The three paragraphs on previous Lines 78-116 were reorganized in two paragraphs: as suggested. The section on previous Lines 148-155 was reduced as suggested The discussion was also modified as suggested: The section presenting the studies that justify that crown defoliation indicates stress was moved to the end of introduction. Few sentences connecting the discussion to the hypothesis H1 and H2 of the introduction were added in the last section of the discussion. Finally, all the minor edits were addressed, except that we kept the formulation that female fecundity was maintained in response to increasing DEF; indeed, the increase is not very clear (as noted by the editor based on FigS8), and the simple fact that reproduction is maintained is sufficient to reject hypothesis H1. We thank again the editor and the recommenders for interesting suggestions, comments and feedback on our work. All authors have read and approved the material being submitted. This article is not being considered for publication elsewhere. With kind regards, Sylvie Oddou-Muratorio
Please accept my apologies for the delay in sending the evaluation, the evaluation of the referee came very late. The referee considers that you have addressed all his comments. I’m also satisfied with the revision and impressed by the detailed work you have done about the proposition of using SEM in the reply letter.
I have only a few very short comments to improve the clarity of the manuscript before writing the final recommendation (only suggestions it is up to you decided whether you want to include them or not),
My main concern on the text is about the introduction that could be shorter and go more directly to the main topics of your MS. Lines 56 – 61, I don’t think that you need to discuss the difficulty to disentangle different stresses as this is not the topic of your MS. Lines 71-73, I would delete this sentence on competition, pest, and fire. Lines 78-116. I would reorganize these paragraphs in two paragraphs: one on studies showing a decrease of fecundity with stress, and one on studies showing that stress stimulates higher reproduction. Lines 148-155: I would reduce the length of this section on the general presentation of beech and its decline in its southern populations and keep only the section on fecundity response to drought.
Then I have only two comments about the discussion. The section where you present the studies that justify that crown defoliation indicates stress (water stress and late frost) would be more useful in the introduction (I think this justifies nicely the use of defoliation as an indicator of stress). Finally, I think it would be important to have at least one sentence to discuss your results in regard to your hypothesis H1 and H2 of the introduction.
Minor comments: Line 139: Change “crown defoliation as an indicator that a given tree has experienced a stress” by “ crown defoliation taken as an indicator of stress” ? Line 160 change “between tree vigor” to “between tree defoliation”, tree vigor is not used in the introduction. Line 190: SEMM was not defined before Line 238: MEMM was not defined before Lines 266 272 273: You use SEMM here but line 298 MEMM. If I understand well after explaining that MEMM is based on SEMM you should use MEMM everywhere (you are using SEMM at other places in the text as well). Lines 304-305: delete “Therefore, we want equation 3 to include a minimal number of such predictors.” unclear to me. Line 318: add a space between “Figure S4).For” Line 341: Why the quadratic DBH is not in equation 4? Line 401. If F female could increase in response to increasing DEF, this agrees with the hypothesis H2. In the rest of the text you never present the results in that way (you use ‘maintain’ rather than “increase”). In the Figure S8, it is difficult to say that F female increases if you consider the confidence interval. Figure 4. What is BAIbfCor? (also used in other Figures in Suppl Mat). Line 439-448: This paragraph explaining why crown defoliation represent stress would be more useful in the introduction. Line 442-443: “together with mean growth, budburst earliness, fungi presence and competition” not needed here I think. Lines 449 change to “The negative effect of crown defoliation on wood growth observed in this study is consistent with physiological response to water stress and late frost, to factors that might lead to defoliation.”? Lines 471-475. These two sentences are unclear. Change to “The negative effect of crown defoliation on female observed in this study is consistent with the expected decrease in photosynthesis and thus in carbon availability induced by leaf fall. The fact that we observed such negative effect on female fecundity but not on male fecundity is consistent with the expected higher resource-limitation of female fecundity (costly nut-seeds) as compared to male fecundity in beech (Lloyd & Bawa, 1984; Obeso, 1988).”?? Line 484: I think in this section it would be good explain what are the conclusion regarding the hypothesis H1 and H2. Line 498 “depend ON the level” Line 513 “portably” probably? Line 548: SEMM or MEMM ? Figure S3 B there is a space before Sampling. Add “Sampling size, MEAN (SD) fecundity and defoliation ...”?
The authors have fully addressed my comments from the first review. Thank you. The paper would benefit from some language polishing. Other than this, I feel that the paper is ready for publication.
https://doi.org/10.24072/pci.ecology.100039.rev21DOI or URL of the preprint: https://doi.org/10.1101/474874
Please see the detailed letter enclosed
First, I’m sorry that the review process has taken longer than usual (this is because of the Christmas vacation), but the three reviewers have provided very thoughtful reviews (the referee are listed by date in the email generated by PCI website as follows referee 1: 2019-01-02, referee 2: 2019-01-21, referee 3: 2019-01-23).
This preprint investigates how crown defoliation affects both tree female and male fecundity and basal area growth in a population at the dry edge of beech distribution. The question explored in this preprint is whether defoliated beech trees have different relative investment in reproduction vs. growth in comparison with non-defoliated trees. To do this, the authors use an innovative method to estimate individual tree effective fecundity based on marker-based parentage analysis of seedling. They have already published a paper describing the methods and using it to test size and competition effect on fecundity (Oddou-Muratorio et al. 2018 Mol Ecol). In this new preprint they connect their fecundity analysis method to broader evolutionary and ecological questions to test the coordination between fecundity and growth and its response to a defoliation stress. This is clearly a very interesting and solid study that will be of wide interest to forest ecologist as shown by the comments of the three referees. The three referees have, however, pointed out several general concerns that need to be solved before a final recommendation can be published.
The main concern that has been pointed out by the three referees is related to the interpretation of tree defoliation as a proxy of drought stress. Tree defoliation can be induced by drought but also by numerous other processes. Thus, if there are no other solid evidences to demonstrate that in your study tree defoliation can be used as a proxy of drought, I think it would be more cautious to focus on tree defoliation per see (an indicator that the tree has experienced a stress but not necessarily a drought stress). In my view this can be solved by substantially down playing the focus on drought in the introduction and the discussion (the analysis are not affected by this issue). The referee 1, 2 and 3 also provide important comments about the binary annual defoliation variable that could be included in the discussion.
Both referee 2 and 3 have questioned the series of the linear regressions that are used to analyze the complex interaction between BAI, DEF and Fecundity (make or female) and proposed path analysis as a more elegant solution for the analysis. I think you should at least clarify the connection between these different regressions and discuss the limitation of your approach compared to path analysis (or structural equation models).
The referee 1 also raised concern about the use of linear relationship for several variables rather than non-linear functions. This can be easily checked based on models residuals.
The three referees provide numerous additional comments that might help to improve the preprint. I have also listed some minor comments below.
Sincerely, Georges Kunstler
line 42: “in response to water stress”. There is no clear evidence in the MS that water stress is the proximal cause of defoliation.
Line 70: Reference “Wiley, Casper & Helliker 2017” is missing in the references list.
Line 111: Reference “Camarero et al. 2015” is missing.
Lines 118-119: “assuming that crown defoliation is a proxy for drought vulnerability” this is a big assumption because defoliation can result from numerous other processes (insect attacks, wind disturbance, …). In my view to claim this you need solid evidence to demonstrate that in your study tree defoliation can be used as a proxy of drought. This is not presented in this version of the preprint. A large part of the introduction and discussion build on this interpretation of defoliation as a proxy of drought. If there are no additional evidences to support this hypothesis I would recommend to rather build the introduction and discussion around defoliation rather than drought stress. (same comment for lines 144-145 on water stress).
Line 161: Change “one of the of the French beech” to “one of the French beech”.
Line 202 Equation 1: Something went wrong with subscript (the sum should be from $\sum{j = 1} ^{n{d_{max}}}$, no?)
Figure 1 page 7: It could be useful to add the circular plots on the panel A.
Line 203: Again some problem with the subscript in $dbh_i$.
Lines 215-216: I don’t know if you have this information but it would be useful to say which years were masting year in the region between 2001 and 2012.
Line 244: You probably need to give more details about the dispersal kernel (even if this is fully explained in your previous paper presenting the method). What are the parameters and their estimate and how do they differ from your previous estimates?
Line 255: “our hypothesis IN that biases” should be “our hypothesis is that biases”?
Line 291: What do you mean by “FULL linear model”?
Line 325: should it be “correlations may be due TO variation in size”?
Line 365 – 366: The fact that “Comp10” has a negative effect whereas “Dens10” has a positive effect could be discussed in more details. This seems quite important given that in your previous publication (Oddou-Muratorio et al. 2018 Mol Ecol) it was not the same.
Lines 372-374: Sentence unclear.
Page 14 Table 1: As pointed out by referee 1 you compute VIFs but doesn’t seem to use them to check for multicollinearity. You call add a sentence such as “For all fitted models variance inflation factors were all below 10, ruling out any serious multicollinearity.”.
Lines 458 – 459: “However, the mitigating effect of increasing tree size on decreasing female fecundity for defoliated tree” sentence unclear.
Line 505: “Long-term consequences for population adaptive response to drought stress” again the lack of clear argument for the connection between defoliation and drought stress makes this subtitle problematic.
Line 521: Reference “Bontemps et al. 2017” is missing.
Line 535: The reference “Hamanishi & Campbell, 2011” is missing.
Line 543: Reference “Gerzabek et al. 2017” is missing.
In this manuscript, the authors analyze the relationship between crown defoliation, basal area growth, and estimates of male and female fecundity in a population of European beech at its south-western distribution margin. Increasing crown defoliation was found to correlate with reduced basal area growth and reduced female fecundity. Growth reductions with increasing defoliation were relatively larger than reductions in female fecundity. Finally, a negative interaction term between basal area growth and defoliation level in the model of female fecundity is interpreted as a trade-off between growth and fecundity: while for non-defoliated trees female fecundity increases with growth, female fecundity decreases with growth for defoliated trees.
I found the topic relevant and timely, and the manuscript overall well-written. My main suggestions relate to the interpretation of results and a potential alternative for data analysis.
While drought is a plausible cause of crown defoliation, it is not the only one. Thus, results should be presented and discussed more carefully with respect to alternative causes of crown defoliation.
It may be useful to formulate the relationships between measured variables in a more explicit hierarchical fashion, which would then lend itself to be analyzed by structural equation models: e.g. competition might affect defoliation and competition and defoliation then affect growth, and all three affect fecundity.
Detailed comments l. 179 Equation for basal area lacks division by 4 l. 179 “relative” increment – I suggest removing “relative” because this seems to be simply the increment, rather than “relative basal area increment”, which would be the BAI divided by the initial BA l. 242 Please state how the estimation of FFj was made identifiable; I assume this was done by enforcing that the mean of FFj was equal to one. l. 255 This hypothesis would benefit from further explanations l. 402 The SSQ values in Table 2 do not seem to correspond to the P-values reported in the table. Please check. l. 570 This sentence seems out of context. Appendix S3 B (Table on sampling size): Add units for fecundity and defoliation variables
https://doi.org/10.24072/pci.ecology.100039.rev11The authors addressed the influence of drought on tree reproduction and forest regeneration in a relict population of European beech located at low elevation in Mediterranean France. They measured defoliation and wood growth, and used both a spatially explicit mating model and parentage analyses to assess female and male fecundities. Female fecundity was less sensitive than growth to defoliation, and decreased more slowly in large individuals. A tradeoff between growth and female defoliation suggested that large individuals could invest less in growth to maintain female fecundity. The authors conclude on some potential evolutionary implications and on the related vulnerability of the relict beech population to climate change.
The manuscript is well-written and easy to follow. The protocol and statistical analyses have been thoroughly designed and performed, although the complex set of linear models could be replaced with a (more appropriate?) Path Analysis or Structural Equation Model (see comments below). A relatively major revision should allow recommendation and publication of this work.
My main comments concern: - The focus on the (long-term?) evolution of drought-resistance traits, which seems to be somewhat speculative on the basis of the present results. The scope should be rather focused on the ecological consequences of drought on growth and fecundity. - The defoliation scores aggregate annual defoliation scores over 9 years. What about the between-year variation in climatic conditions and drought stress? For instance, the 2003 year had a very hot summer that could be much detrimental. Is there a specific signature of extreme drought stress experimented during this specific year? In addition, it would be interesting to analyze how the number of defoliated trees per year, or the binary defoliation state of individuals per year, depends to the variation of drought stress over years. - The inference of female/male fecundities is highly parameterized (one fecundity value for each tree). Although I understand the overall logic of SEMM analyses and a priori trust its ability to provide proper inferences, it would be useful to include some further results of cross-validation and credible intervals of the estimated parameters in an Appendix. - the rationale of equation (3') (L316) is quite confusing: here DEF is a function of predictors that are also included in equation (3) where DEF is also a predictor. The same issue also applies for eq. (4), as BAI becomes a predictor while it was an explained variable in eq. (3). In order to disentangle direct and indirect effects of predictors on BAI and fecundity variables, shouldn't some Path Analysis be more appropriate? - It is quite confusing that BAI is not actually a measure of relative increment. It should be divided by BA in 2002 to do so. Because it is still an absolute measure, a few big trees can have large BAI values.
Further detailed comments:
L37-39: based on previous and next sentences, is the trade-off specific to larger individuals?
L42-43: "compromise the evolution of drought-resistance traits" is debatable based on the present results.
L49-97: there is much focus in the first paragraphs on the influence of drought and deaf defoliation on reproduction, although the central objective of the paper is to address a joint influence of drought on growth and reproduction through defoliation. I would suggest better emphasizing the hypotheses on both growth and reproduction from the beginning, to better introduce the general scope. Only from L92 the topic of growth is briefly introduced.
L89: what "water ability" means?
L98: "evidence"
L99: "tree orchards"
L117: the focus on evolutionary dynamics sounds marginal here, although it is one of the key points in conclusion of the Abstract. In general, the Introduction does not emphasize well the motivation and objective of working on evolutionary dynamics.
L166: "Acer monspessulanum"
L167: what "intensively" means here?
L176: indicate here the number of individuals in the subset.
L178-179: unclear what a "quadratic measure of size" really means.
L179: the formula should be BA=Pi*(DBH/2)^2.
L179-L180: the formula here does not represent a "relative increment", it is rather an absolute increment.
L184: it is unclear how the aggregate defoliation score can represent both the recurrence of defoliation and the ability to recover from defoliation. More specific indexes should probably be designed to identify these specific components (see also my general comment on the aggregate measure of defoliation).
L202: to avoid confusion, "max" should be a subscript here. In addition, it is not clear why dmax appears in the equation: shouldn't it be instead ndmax? It is unclear how the individuals j are summed in a given radius dmax. The equation may be rewritten to clarify that.
L255: "is that biases".
L265: "SEMM-based"?
L300-302: it seems that the approach performing separate models with Densdmax and Competdmax, for different dmax and without interactions, does not allow selecting dmax values without bias if interactions actually play. Potential issues should be at least discussed.
L323: not sure to get what "individual correlation" means here.
Fig. 2B: isn't it a bit surprising that there is not a better correspondence between BAI and radial growth?
L349: not sure that the precision on more or less "L-shaped" pattern is really useful.
L368-369: this result has already been mentioned just before.
L389: provide Figure number.
Figure 3: it is not completely clear for me how the confidence intervals represent the estimation of interaction terms in the panels. Maybe provide some more information on what the interaction plots precisely represent here?
Figure 4: it seems that a few large defoliated trees have still large BAI and greatly contribute to the overall variation here.
L417: remove "significant".
L462-473: it seems that this paragraph should be better connected with, or ever merged, with the next section on the trade-off between growth and reproduction.
L509: "that" instead of "which".
L505-544: this final section sounds a bit speculative and quite outside the basically ecological scope of the paper (see also main comments above). Some more specific points:
General comments:
Sylvie Oddou-Muratorio and colleagues investigated associations between crown defoliation, radial tree growth, tree size, competition and female/male fecundity in a drought-prone beech population in Southern France. Reproductive beech trees were analyzed to estimate female/male fecundity. Increases in crown defoliation, competition and tree size resulted in decreases in both female fecundity and tree growth.
In general, I liked the approach that was used in this study. Allocation trade-offs between various tree compartments is an important research topic in tree ecology. However, several issues arose when reading the paper, which I want to briefly summarize:
Because the beech trees belonged to a drought-prone tree population, the findings were interpreted and presented in the context of drought effects (e.g. in the Summary L20-25, L42-43; most of the Introduction; a large part of the Discussion). However, the study does not explicitly consider any observed variability of drought conditions neither in space (e.g. different beech populations along a drought gradient) nor along time (e.g. year-to-year changes of drought conditions). Thus, there is no control, which would allow to assess the effects of drought on the findings. While there are some information about beech and its susceptibility to drought (L128-L140), the same analyses as conducted in this study should have been conducted at other sites as well.
The variable “annual defoliation scores” was derived from observations over 9 years, whether dead branches and leaves were present. Dead branches and dead leaves should have been assessed separately, and rather than using just presence or absence, a percentage (or number, if applicable) of dead branches and leaves, respectively, should have been used. I guess that even under rather moist conditions, there are always a few dead branches or leaves. Dead branches are often a result of the natural tree development, which are not necessarily related to drought.
BAI is a non-linear function of age or tree size, i.e. BAI is increasing up to some culmination point and then decreases. A linear relationship is found for younger/smaller trees, but not for older trees. The DBH distribution in Fig. 4 tells us that the observed trees are rather big, i.e. increasing BAI is expected to be followed by decreasing BAI within the same tree. Thus a linear relationship with DBH does not allow to model the change in BAI (equation 3). A simple solution to that problem is to use a quadratic function of DBH (DBH, DBH^2) or to use a spline function. Also for the other variables in the same equation, it is not obvious whether linear relationships are useful. This needs to be checked visually using scatter plots between each predictor variable and each response variable. The fitted models should be checked using diagnostic plots.
Specific comments:
L19: After reading the summary, it is not clear whether the paper is about individual severe droughts or about long-term drought conditions. It is further unclear, whether the effects of drought on the investigated processes have been really tested.
L26: It should be specified what is meant with wood growth (e.g. ring width, BAI).
L35: The term "twice less strong" needs to be rephrased.
L68: Omit “induced”.
L87: Omit "a coniferous species".
L89: Do you mean "availability" rather than "ability"?
L101: "Hot, dry summers" do not fit into this context, since they are neither considered an experiment nor a cultural practice.
L119-123: The problem with testing these hypotheses is that there is no control, e.g. no comparison of drought and non-drought years or periods is made.
L132: Write "altitudinally".
L161: Omit the second "of the".
L179: Correct is “BA = pi * (DBH / 2)^2”
L181-182: I wonder whether this measure is useful, see my general comments. A tree with only few dead branches or leaves is classified in the same way as a tree with many dead branches or leaves.
L203: Only "i" (dbhi) and "j" (dbhj) should be written in subscript.
L204: ndmax does not occur in the equation.
L276: Write "and combined the".
L281-282: Write "After sanding, cores...".
L292-293: See my general comments.
L306: Software like SAS uses procedures, R uses functions.
L324: I'm not sure whether this is a useful approach, and this is related to one of my general comments. Defoliation ranges between 0 and 100%, i.e. the values are part of a continuum. With the suggested arbitrary classification into two groups, a tree with 0% defoliation is assigned to one group, whereas a tree with 1% defoliation is assigned to the other group.
L329-330: Here too, whether the relationships are linear first needs to be checked visually (particularly for BAI).
L331-332: Does this mean that the expected BAI and DEF, respectively, are used (i.e. the predicted values)?
L396: Rather than excluding BAI=0 values and log-transform the remaining raw BAI, it is possible to fit a GLM model with normally distributed errors and a log-link function for the expected BAI values.
L397-403: Although the VIFs were calculated, it does not get clear, what was done with this information. VIFs > 4 tell us that the variable is correlated with other predictors, which need to be checked. VIFs > 10 indicate serious multicollinearity.
L404 (Fig. 3): None of these figures here nor in the Supplement allows to asses, how well the models are fitted to the data. I suggest to add the observations to the plots.
L408: Why are 80% confidence intervals shown? Standard is a 95% CI.
L417: However, because the control is missing, we don't really know how the trees respond to water stress (see my general comments).
L423-424: The described processes are generally plausible, however, there are no observations for the study site.
L469: Write "was shown".
L475: To test this hypothesis, observations at a dry site (such as the one in this study) and a moister site should have been taken, or even better observations along a drought gradient.
L505: The response to drought stress was not explicitly measured, thus the conclusions in this chapter are rather speculations.
L509-510: This is not shown in this paper.
https://doi.org/10.24072/pci.ecology.100039.rev13