
Recommendation
Conservation biology is strongly rooted in the theory of island biogeography (TIB). In island systems where the ocean constitutes the inhospitable matrix, TIB predicts that species richness increases with island size as extinction rates decrease with island area (the species-area relationship, SAR), and species richness increases with connectivity as colonisation rates decrease with island isolation (the species-isolation relationship, SIR)[1]. In conservation biology, patches of habitat (habitat islands) are often regarded as analogous to islands within an unsuitable matrix [2], and SAR and SIR concepts have received much attention as habitat loss and habitat fragmentation are increasingly threatening biodiversity [3,4].
The existence of SAR in patch-matrix systems has been confirmed in several studies, while the relative importance of SIR remains debated [2,5] and empirical evidence is mixed. For example, Thiele et al. [6] showed that connectivity effects are trait specific and more important to explain species richness of short-distant dispersers and of specialist species for which the matrix is less permeable. Some authors have also cautioned that the relative support for or against the existence of SIR may depend on methodological decisions related to connectivity metrics, patch classification, scaling decisions and sample size [7].
In this preprint, Laroche and colleagues [8] argue that methodological limits should be fully understood before questioning the validity of SIR in patch-matrix systems. In consequence, they used a virtual ecologist approach [9] to qualify different methodological aspects and derive good practice guidelines related to patch delineation, patch connectivity indices, and scaling of indices with species dispersal distance.
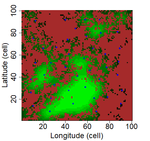
Laroche et al. [8] simulated spatially-explicit neutral meta-communities with up to 100 species in artificial fractal (patch-matrix) landscapes. Each habitat cell could hold up to 100 individuals. In each time step, some individuals died and were replaced by an individual from the regional species pool depending on relative local and regional abundance as well as dispersal distance to the nearest source habitat cell. Different scenarios were run with varying degrees of spatial autocorrelation in the fractal landscape (determining the clumpiness of habitat cells), the proportion of suitable habitat, and the species dispersal distances (with all species showing the same dispersal distance). Laroche and colleagues then sampled species richness in the simulated meta-communities, computed different local connectivity indices for the simulated landscapes (Buffer index with different radii, dIICflux index and dF index, and, finally, related species richness to connectivity.
The complex simulations allowed Laroche and colleagues [8] to test how methodological choices and landscape features may affect SIR. Overall, they found that patch delineation is crucial and should be fine enough to exclude potential within-patch dispersal limitations, and the scaling of the connectivity indices (in simplified words, the window of analyses) should be tailored to the dispersal distance of the species group. Of course, tuning the scaling parameters will be more complicated when dispersal distances vary across species but overall these results corroborate empirical findings that SIR effects are trait specific [6]. Additionally, the results by Laroche and colleagues [8] indicated that indices based on Euclidian rather than topological distance are more performant and that evidence of SIR is more likely if Buffer indices are highly variable between sampled patches.
Although the study is very technical due to the complex simulation approach and the different methods tested, I hope it will not only help guiding methodological choices but also inspire ecologists to further test or even revisit SIR (and SAR) hypotheses for different systems. Also, Laroche and colleagues propose many interesting avenues that could still be explored in this context, for example determining the optimal grid resolution for the patch delineation in empirical studies.
References
[1] MacArthur, R.H. and Wilson, E.O. (1967) The theory of island biogeography. Princeton University Press, Princeton.
[2] Fahrig, L. (2013) Rethinking patch size and isolation effects: the habitat amount hypothesis. Journal of Biogeography, 40(9), 1649-1663. doi: 10.1111/jbi.12130
[3] Hanski, I., Zurita, G.A., Bellocq, M.I. and Rybicki J (2013) Species–fragmented area relationship. Proceedings of the National Academy of Sciences U.S.A., 110(31), 12715-12720. doi: 10.1073/pnas.1311491110
[4] Giladi, I., May, F., Ristow, M., Jeltsch, F. and Ziv, Y. (2014) Scale‐dependent species–area and species–isolation relationships: a review and a test study from a fragmented semi‐arid agro‐ecosystem. Journal of Biogeography, 41(6), 1055-1069. doi: 10.1111/jbi.12299
[5] Hodgson, J.A., Moilanen, A., Wintle, B.A. and Thomas, C.D. (2011) Habitat area, quality and connectivity: striking the balance for efficient conservation. Journal of Applied Ecology, 48(1), 148-152. doi: 10.1111/j.1365-2664.2010.01919.x
[6] Thiele, J., Kellner, S., Buchholz, S., and Schirmel, J. (2018) Connectivity or area: what drives plant species richness in habitat corridors? Landscape Ecology, 33, 173-181. doi: 10.1007/s10980-017-0606-8
[7] Vieira, M.V., Almeida-Gomes, M., Delciellos, A.C., Cerqueira, R. and Crouzeilles, R. (2018) Fair tests of the habitat amount hypothesis require appropriate metrics of patch isolation: An example with small mammals in the Brazilian Atlantic Forest. Biological Conservation, 226, 264-270. doi: 10.1016/j.biocon.2018.08.008
[8] Laroche, F., Balbi, M., Grébert, T., Jabot, F. and Archaux, F. (2020) Three points of consideration before testing the effect of patch connectivity on local species richness: patch delineation, scaling and variability of metrics. bioRxiv, 640995, ver. 5 peer-reviewed and recommended by PCI Ecology. doi: 10.1101/640995
[9] Zurell, D., Berger, U., Cabral, J.S., Jeltsch, F., Meynard, C.N., Münkemüller, T., Nehrbass, N., Pagel, J., Reineking, B., Schröder, B. and Grimm, V. (2010) The virtual ecologist approach: simulating data and observers. Oikos, 119(4), 622-635. doi: 10.1111/j.1600-0706.2009.18284.x
DOI or URL of the preprint: https://doi.org/10.1101/640995
Dear authors,
Thank you very much for your revised pre-print, which has improved substantially. Both the reviewer and I are largely happy with the current version, and only have commented on some smaller issues. You will find my comments below and the reviewer's comments in a separate file. I would kindly ask you to revise your pre-print accordingly before my recommendation.
Many thanks and all the best, Damaris Zurell
Specific comments: L 39. edit „patch connectivity“
L 83. „studies about connectivity effects may have suffered from a lack statistical power“ - could you add a half-sentence explaining how this is meant, e.g. is this related to sample size issues?
L95. Similar to the reviewer, I would also prefer talking about hypotheses rather than predictions. Additionally, I highly recommend revising these to make them absolutely self-explanatory and well justified., e.g. L 95-99: the difference between hypothesis 1 and 2 is not entirely clear here. (More specifically, I think the patch delineation in H1 needs explanation to make the difference clearer) L99-101: the third hypothesis is not self-explanatory and it would be nice to justify this hypothesis.
L 122-125. Please rephrase the sentences, e.g. „Higher values of the Hurst exponent for a given value of habitat proportion increased the size of contiguous habitat patches and decreased the number of patches (Fig. S2). Higher habitat proportion for a constant Hurst exponent value also resulted in larger mean size of contiguous habitat patches.“
L184-185: I suggest adding a small note that the different indices relate to the different buffer radii, and the different scale parameters paired with fine and coarse patch delineation.
L207-208: restructure, e.g. „For each combination of meta community simulation and connectivity index, we computed the R2 coefficient of the linear model Species richness ~ Patch connectivity + (Patch connectivity)2, and henceforth refer to this as the explanatory power of the connectivity index.“
L227-234: I suggest to move this paragraph up to the general approach L203-211 to separate estimation of R2 and subsequent analyses of these R2.
L240-248: Here, you are suddenly adding hypotheses that you haven’t introduced before. Also, I wonder why you separately test these additional effects. If you want to keep this complexity, I suggest to (1) rephrase to state that you test for the effect of patch delineation while controlling also for the other factors, and (2) build a model where you analyze all of these point together: R2spec ~ patch delineation + Hurst exponent + habitat proportion + dispersal distance + patch delineation:Hurst exponent + patch delineation:habitat proportion + patch delineation:dispersal distance
L333. edit „sometimes laid at the higher end of the explore range“ (and analogous edits in L334-335)
L362. edit „lied“ to „ranged“ - also, please check throughout the text that you don’t use the word „lied“ (=told a lie)
L361-367: this paragraph seems out of place as it disrupts the results for hypotheses 1-3
L 408/445/481/517: It’s rather uncommon to use the analyses steps as sub-headings in the discussion. If using sub.headings here, these should rather indicate a main finding.
L431: edits „ This particularly affects“
L481-517: again, this part seems a little out of place
L517-536: similar to the introduction, this hypothesis is not properly justified, and also here the relationship is not well explained. I would suggest expanding a little bit on this topic.
DOI or URL of the preprint: https://doi.org/10.1101/640995
Version of the preprint: 2
The revised pre-print has now been seen by two independent reviewers, one of which had reviewed it before. Both acknowledge the potential merit of the study but also identify points that need revision. Also in my opinion, the pre-print has improved substantially. Nevertheless, I would recommend another round of revision to improve the presentation and clarity but also resolve some methodological questions. Below I provide some thoughts additional to the reviewer reports. Many thanks for considering PCI Ecology
First, I highly recommend shortening the introduction and re-thinking the structure of it. An introduction should generally start broad and become more specific. In the current pre-print the authors don’t have a coherent story arc in the introduction yet that guides the reader from broad to specific. For example, the second paragraph L 39-48 is already very specific while the following paragraphs become broader again (for example, the next paragraph mentions another concept - the functional connectivity - without explaining it in detail). It is thus still a little difficult identifying the story thread here. As a suggestion, you could first make the point that some studies did not find support for the TIB or were questioning its validity, and that you argue that this may be related to methodological choices and to landscape properties. Then, I would actually expect the resolution of the introduction around L 89-106 while here you start with a whole new story line, discussing patch delineation, the raster perspective, y-diversity, and connector indices. So, basically I suggest shortening the introduction by 30-50% and restructuring, highlighting only those aspects that are necessary to grasp the main objectives of the study.
Second, the objectives of the study and the general workflow are still a bit vague/hidden. I would suggest describing a clear road map at the end of the introduction or at the beginning of the methods. What exactly is being tested and when? This may also help following the description of the methods section. In their response letter, the authors argued that they now used the sign posts "patch delineation“, „index scaling“ etc. in all sections. However, I don’t think this works very well in the methods part. Here, you should very clearly state what exactly is being tested (objectives) and how the corresponding analyses are done. At the moment, this is a bit confusing. For example, the authors state that they first test connectivity indices on species richness and store the resulting R2 (L 292-305), then analyzed R2 in relation to resolution and fragmentation of the landscape (L306-320), then analyzed the effect of connectivity on species richness for fine patch delineation (L 321-323) followed again by analyses of R2 (L 325-329) and so forth. This part could be much more condensed by clearly separating the simulation scenarios from the subsequent analyses.
Third, the results do not describe the simulation output at all. When using virtual data, the simulated patterns should be described before using these as test grounds. If I am not mistaken, in this pre-print, the authors aim to test under which circumstances missing connectivity effects on species richness can be interpreted as divergence from TIB principles and under which circumstances the results are affected by methodological decisions. So, the first question is whether connectivity does affect species richness in all scenarios. What species richness patterns were simulated and how were these affected by dispersal? I think making clear what patterns emerged from the simulations and which of these patterns were picked up by the connectivity indices, is vital to answering the questions under which circumstances TIB is valid and under which circumstances this could be picked up by connectivity indices.
Fourth, the discussion should start with a paragraph summarizing the overarching objectives and findings before discussing each result in detail.
Some additional line comments:
L 50: the author(s) of Ref 6 should be spelled out here as it is used as subject in this sentence. Same in L 83, L 94 (and more probably more instances).
L 52: edit „ca. 20%“
L 55: I feel that „functional connectivity indices based on surrounding populations“ as well as the „multiple life stages with contrasted requirements“ should be explained a bit more.
L 285-291: Which error distribution was assumed and how was R2 computed? With species richness as response, you would need to use a generalized linear model (rather than a simple linear model) with a log-link. Generalized linear models do not normally output R2. (Same in L 299).
L 306-308 and L 321-329: Similarly to above, R2 is bounded between 0 and 1 and thus violates the assumption of normally distributed errors. A linear model is inappropriate in this case.
DOI or URL of the preprint: https://doi.org/10.1101/640995
The preprint "Simulated neutral metacommunities support the habitat amount hypothesis" uses a neutral metacommunity model to simulate communities in fragmented landscapes, and based on these simulated data the authors test the relatedness of different connectivity indices and their value in explaining species richness. Two independent reviewers have assessed the preprint and both acknowledged the ambition and effort taken in the preprint. Specifically, both reviewers found that a comparison of existing connectivity indices is valuable to guide future analyses. However, the reviewers also raised some criticism, mainly regarding the presentation and structure of the preprint as well as the discussion of results. Overall, I find the reviewers comments very thoughtful and constructive and hope they will help further improving the preprint. I add some own thoughts below. I hope reviewers' and my comments will help improving the preprint and I would welcome a revision.
My main concern is the streamlining of the preprint. The simulations and analyses are quite complex and require very clear sign posts for guiding the reader. This was also echoed by one of the reviewers. The authors suggest that studying the question how structural connectivity affects species presence and species richness would be facilitated by three methodological advances: optimizing indices, combining indices and changing the grain of habitat description (L 82-86 / L 463-465). However, I find this point not developed well enough in the text. First, in the introduction, it should be explained a bit more whether this proposition stems form existing literature (reference) or is an original proposition by the authors. In any case, this point needs elaboration and clear explanation as it is central to the preprint. For example, what exactly do the authors mean by "optimizing"? Then, one way forward for streamlining could be to make it explicit throughout the text, which analyses step corresponds to which of these three suggestions - that's one example of guiding the readers with sign posts. The study is very complex and very technical, so sign posts are vital for not losing the reader in to many technical details and jargon. I would also consider changing the title of the preprint as it does not reflect the goal of testing the different indices or even improving them. My intuitive expectation when reading the title "Simulated neutral metacommunities support the habitat amount hypothesis" would be that the preprint concentrates on exploring the habitat amount hypothesis (or more generally, the SLOSS debate) in different fragmentation scenarios, which is not exactly what the study is doing.
Abstract: some phrasing in the abstract is a little vague. Again, I suggest placing clear sign posts. For examples, in phrases such as L 11-12 "the effect of connectivity on species presence and community richness in empirical studies is often quite limited" or L 27 "leading to very strong effect sizes upon community richness", the context is not entire clear. I suggest clarifying up front what the background is to this study, which is the question in how far connectivity between patches contributes to explaining species richness. It is all there in the abstract (e.g. L21-22 "the most fruitful methodological choice to improve the explanation of species richness"), but a little rephrasing, restructuring and signposting will help the reader to identify the red line.
Minor comments: L 32-51. Also in niche theory it is generally acknowledged that dispersal or colonization ability are important determinants of species' distributions. See for example the BAM diagram introduced in Soberon (2007; Ecol Letters, doi: 10.1111/j.1461-0248.2007.01107.x) and cited often. I feel this would be worth acknowledging here.
L 41. "TIB" - abbreviation not defined yet.
L 46-51: As the study seems to hinge heavily on these statements or references, these should be discussed in more detail.
L 82-86: is there any reference that supports these suggestions?
L 141. Maybe spell out again briefly which factors were varied to make up 2700 simulations.
L 159-160: either spell out the names of the indices instead of just providing the abbreviation, or at least reference Table 1 here.
L 187-189. The rationale for scaling "the 63 vectors to mean 0 and variance 1" should be explained here. Also, in L 192-193 - Does averaging over the 90 landscapes not result in discarding valuable information about the variance, e.g. variance introduced through different spatial clustering (Hurst factors)? I would consider standardising the distance matrices by the variance over all matrices of the 90 landscapes, and use these standardised values for clustering instead of the simple mean.
Fig.1/Fig.2 - referring to the Appendix to understand the indices names is maybe not the best. Consider including simplified names in the figures.
Additional requirements of the managing board:
As indicated in the 'How does it work?’ section and in the code of conduct, please make sure that:
-Data are available to readers, either in the text or through an open data repository such as Zenodo (free), Dryad or some other institutional repository. Data must be reusable, thus metadata or accompanying text must carefully describe the data.
-Details on quantitative analyses (e.g., data treatment and statistical scripts in R, bioinformatic pipeline scripts, etc.) and details concerning simulations (scripts, codes) are available to readers in the text, as appendices, or through an open data repository, such as Zenodo, Dryad or some other institutional repository. The scripts or codes must be carefully described so that they can be reused.
-Details on experimental procedures are available to readers in the text or as appendices.
-Authors have no financial conflict of interest relating to the article. The article must contain a "Conflict of interest disclosure" paragraph before the reference section containing this sentence: "The authors of this preprint declare that they have no financial conflict of interest with the content of this article." If appropriate, this disclosure may be completed by a sentence indicating that some of the authors are PCI recommenders: “XXX is one of the PCI XXX recommenders.”
Confidential Comments to the Editor The manuscript entitled “Simulated neutral metacommunities support the habitat amount hypothesis” utilizes simulations to examines the effect of connectivity indices on species presences and community richness. The authors found that buffer indices (or flux indices – i.e., patch structural connectivity indices based on the distance between the focal patch and the surrounding habitat - generated from habitat cells instead of habitat patches) improves explained species richness within landscapes. The MS is somehow original and addresses an important issue in the habitat literature: the effect of habitat amount decoupled from habitat fragmentation on specie’s ecological responses. However, I think the manuscript needs to define better its hypothesis and predictions and improve significantly the writing style.
Comments to the Author The manuscript entitled “Simulated neutral metacommunities support the habitat amount hypothesis” utilizes simulations to examines the effect of connectivity indices on species presences and community richness. The authors found that buffer indices (or flux indices – i.e., patch structural connectivity indices based on the distance between the focal patch and the surrounding habitat - generated from habitat cells instead of habitat patches) improves explained species richness within landscapes.
1) General comments Novelty
The authors analyze the role of metrics of connectivity indices in virtual metacommunity models to predict species richness. The literature on the subject is somehow expressive. The authors evaluate current connectivity methods, combined methods and changes in the grain size from habitat patch to habitat cell to improve model performance.
Writing style and paper message.
The manuscript is not easy to follow, and the main message of the paper is hard to grasp. Part of the reason is because the manuscript lacks a set of hypothesis/ predictions to be tested. Take for example the last paragraph of the introduction (L. 100-107): what do the authors mean by “refine previous results about how optimizing flux connectivity indices modulate the effect size of connectivity on local species richness by considering a broad set of indices with contrasted scaling and heterogeneous theoretical backgrounds in a single study”? The MS requires a complete revision to clarify the research hypotheses and predictions. A second part of the problem is that the flow of the ideas in the MS is truncated due to long sentences. I recommend a complete revision of the paper to address the messages clearer.
2) Specific comments for revision
a) Major issues
Community composition vs. species richness
The authors use “species richness” and “community composition” as interchangeable terms, which I find confusing. Species composition refers to species “a”, “b”, “c”…and “n” within a given unit. Species richness refers to a simply number of species within the unit. The main conclusion of the manuscript it that buffer connectivity indices improve models’ ability to evaluate species richness at the landscape level. Thus, I suggest re-framing the MS accordingly.
Habitat amount hypothesis
The link between connectivity indices and the habitat amount hypothesis proposed by Fahrig (2013) became clear to me only in the discussion section (L. 387-389). Thus, I believe that this link needs to be better explained right at the beginning of the MS. Perhaps the authors could use that hypothesis to derive their predictions to be tested in the MS. Statistical analysis
1) Spatial autocorrelation The authors considered habitat cells away from each other’s for a minimal distance of 12 cells to reduce spatial autocorrelation. Is there a way of defining this minimal distance empirically? How do they know that 12 cells is the minimal distance to reduce spatial correlation? I suggest addressing the spatial autocorrelation empirically at different distances (# cells), i.e. a sort of sensitive analysis before defining the minimal distance.
b) Minor issues
L. 32-33. I see no reasonability to talk about niche theory or species composition if the study address problematics related to species richness.
L. 36-38. This phrase is too long and confusing.
L. 38 “…thanks to large population sizes” replace by “from reduced population sizes”.
L. 53-57. This phrase is too long and confusing.
L. 80-81. I would argue that the “habitat amount hypothesis” pre
L. 101-104. This phrase is too long and confusing.
L. 100-107. The manuscript lacks clear hypothesis and predictions to be teste.
L. 223. The paragraph lacks a top sentence. What is the meaning of a high correlation between the Cis? Why
L. 418-420. This phrase is not clear. Please add further explanation of the example provided.
https://doi.org/10.24072/pci.ecology.100055.rev12